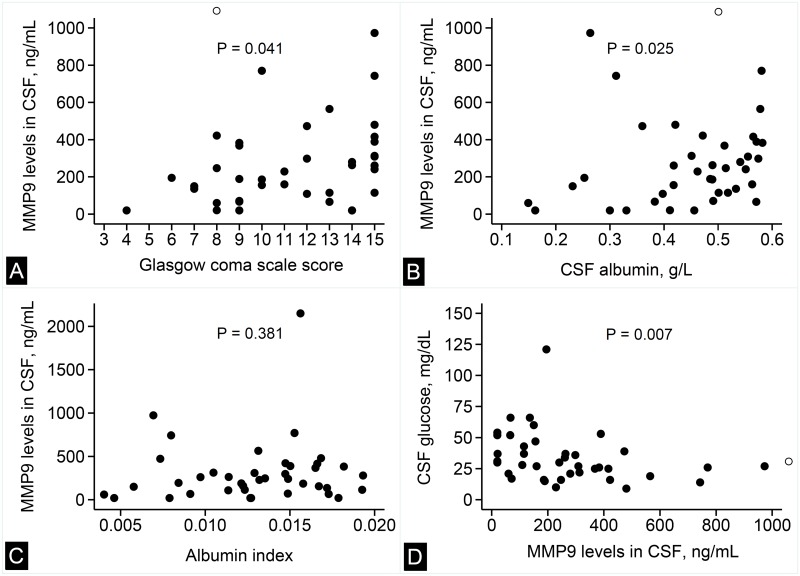
Fig 2. Correlation of MMP9 levels with clinical and laboratory variables.
Scatter plots showing the correlation between MMP9 in the CSF with Glasgow coma scale score (panel A), CSF albumin levels (panel B), albumin index (panel C), and CSF glucose levels (panel D). In panels A,B and D, the hollow circle indicates an extreme value of CSF MMP9 level (2150 ng/mL). P-values are for Spearman’s rank correlation.

