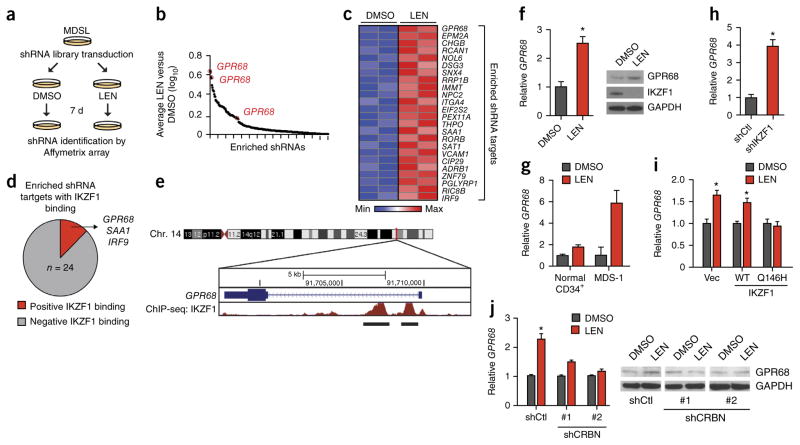
Figure 1.
A genome-wide RNAi screen identifies determinants of LEN sensitivity in MDS. (a) Schematic outline of the LEN-resistance screen performed in MDSL cells, using whole-transcriptome human lentiviral-packaged (GFP+) shRNAs. (b) Log10 ratios for the abundance of individual shRNAs in MDSL cells treated with LEN versus those treated with DMSO, as calculated from the average of two biological replicates. Each dot represents an enriched individual shRNA. Only shRNA targets with a LEN: DMSO ratio >1.0 are shown. (c) shRNAs enriched ≥1.5-fold are shown in a heat map for two independent biological replicates of the RNAi-screen. Colors are represented as fold change of shRNA abundance in the LEN-treated group as compared to that in the DMSO-treated group. The most-enriched and significant shRNA clone for each gene is listed on the right. Significance of the listed shRNA clone for each gene was determined by FDR-adjusted P < 0.05. (d) Summary of IKZF1 binding to the promoters of the 24 genes identified in the RNAi-enrichment analysis, as assessed by ChiP-Seq from published ENCODE consortium data17. (e) Schematic of IKZF1-binding sites within the promoter of GPR68, as assessed by ChiP-seq analysis. The numbers within the chromosome schematic indicate band identifications. The numbers above GPR68 indicate the base pair positions. (f) GPR68 mRNA expression (left), and GPR68 and IKZF1 protein expression (right), in MDSL cells that were treated with DMSO or 10 μM LEN (n = 3). GAPDH was used as a loading control. (g) GPR68 mRNA expression in primary CD34+ (n = 4 per group) and primary MDS BM HSPCs (MDS-1) (n = 3 per group; error bars were derived from technical replicates) that were treated with DMSO or 10 μM LEN. (h) Relative GPR68 mRNA levels in MDSL cells expressing either an shRNA targeting IKZF1 or a control shRNA (n = 2 per group from independent experiments; error bars were derived from biological and technical replicates). (i) Relative GPR68 mRNA levels in MDSL cells that were transduced with a construct encoding either WT IKZF1 or the degradation-resistant IKZF1Q146H mutant (Q146H) and subsequently treated with DMSO or 10 μM LEN for >2 d (n = 2 per group; error bars were derived from biological and technical replicates). (j) Relative GPR68 mRNA levels (n = 3 per group from independent experiments) (left) and representative western blot analysis (of n = 2) of GPR68 protein expression (right) in MDSL cells after knockdown of CRBN with either of two independent shRNAs (shCRBN #1 and shCRBN #2) and treatment with DMSO or 10 μM LEN for 4 d. shCtl indicates cells that expressed a control shRNA. Throughout, error bars represent mean ± s.e.m. *P < 0.05 by Student’s t-test.

