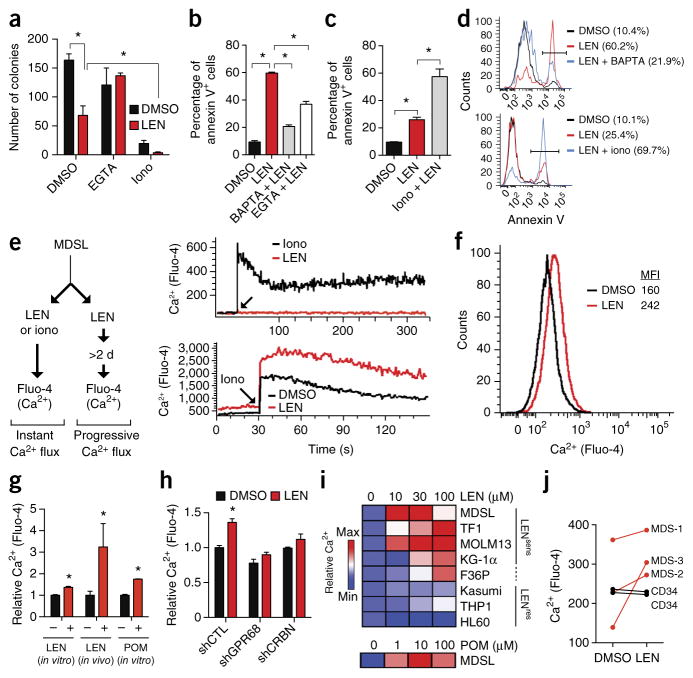
Figure 3.
LEN sensitivity is determined by GPR68-mediated intracellular calcium flux. (a) Colony formation by MDSL cells that were treated with DMSO or 10 μM LEN alone, or with either 1 mM EGTA or 2 μM ionomycin (iono) in the presence or absence of 10 μM LEN (n = 3 per group from independent experiments). (b) Annexin V staining of MDSL cells that were treated with 5 μM BAPTA or 200 μM EGTA, with or without 10 μM LEN (n = 2 per group from independent experiments; error bars were derived from biological and technical replicates). (c) Annexin V staining of MDSL cells that were treated with 400 nM ionomycin, with or without 10 μM LEN (n = 4 per group from independent experiments). (d) Representative histograms from b (top) and c (bottom). Parentheses indicate the percentage of annexin V+ cells under the bar. (e) Left, schematic of acute or progressive intracellular calcium (Ca2+) flux analysis in MDSL cells, using Fluo-4. Right, representative histograms for kinetics of intracellular calcium levels in MSDL cells after the immediate addition of 10 μM LEN or 5 μM ionomycin (top), or after treatment with DMSO or 10 μM LEN for 2 d and then treatment with 5 μM ionomycin (bottom) (n = 3). (f) Representative histogram for intracellular calcium levels (using Fluo-4) in MDSL cells that were treated with DMSO or 10 μM LEN for 2 d (n = 3). MFI, mean fluorescent intensity. (g) In vitro intracellular calcium levels in MDSL cells that were treated with DMSO, 10 μM LEN, or 1 μM POM for 4 d, or in vivo calcium levels in MDSL cells that were engrafted in NSG mice, which were subsequently injected with DMSO or LEN (25 mg/kg) for 4 d (n = 4 mice per group). (h) Intracellular calcium levels in MDSL cells that were treated with DMSO or 10 μM LEN after knockdown of GPR68 or CRBN expression (n = 3). (i) Relative intracellular calcium levels in MDS and AML cell lines that were treated with the indicated concentrations of LEN or POM for 7 d. LENsens, LEN sensitive; LENres, LEN resistant. (j) Intracellular calcium levels in BM cells from patients with MDS (n = 3) and in normal CD34+ cells from healthy control individuals (n = 2), following treatment with DMSO or 10 μM LEN for 2–4 d. Throughout, error bars represent mean ± s.e.m. *P < 0.05 by Student’s t-test.

