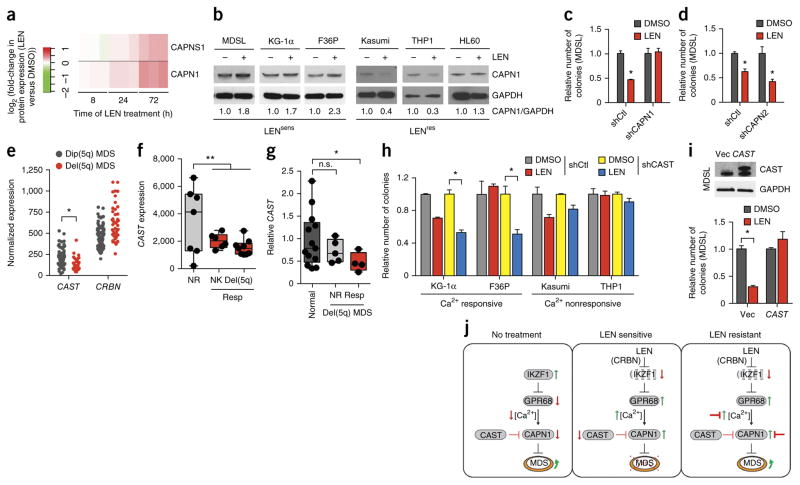
Figure 5.
Loss of CAST expression and increased CAPN1 expression confer sensitivity of MDS cells to LEN. (a) Expression of CAPNS1 and CAPN1 protein in LEN-sensitive MDSL cells after treatment with LEN for the indicated periods of time. The heat map summarizes the fold change (log2) in CAPNS1 and CAPN1 protein expression after LEN treatment, relative to that for DMSO treatment, in triplicate samples (vertical rectangles). (b) Representative immunoblot analysis (of n = 2) for CAPN1 expression in MDS and AML cell lines that were treated with DMSO or 10 μM LEN for 4 d. (c,d) Colony formation by MDSL cells that express either shCAPN1 (c) or shCAPN2 (d), in the presence of DMSO or 10 μM LEN (n = 3 per group from independent experiments). (e) Expression of CAST and CRBN mRNA in CD34 BM cells from patients with MDS who have either del(5q) (n = 29) or a normal karyotype (dip(5q); n = 93), as obtained from publicly available data27. (f) Expression of CAST mRNA in BM cells from patients with MDS patients who have either del(5q) or a normal karyotype (NK) and that either responded (Resp) (n = 15) or did not respond (NR; n = 7) to LEN treatment, as obtained from publicly available data34. The box-and-whisker plots show the median, the 25th–75th percentiles, and range of values. (g) Relative baseline expression of CAST, as determined by qRT–PCR, in BM cells from healthy control individuals (n = 13) and from either LEN-responsive (Resp; n = 4) or nonresponsive (NR; n = 5) patients with MDS. Data is shown relative to that for normal controls. (h) Colony formation by MDS and AML cell lines expressing shCAST or shCtl that were treated with DMSO or 10 μM LEN (n = 3 per group). Cell lines were grouped on the basis of their Ca2+ level increases after LEN treatment (Fig. 3i) as either Ca2+ responsive or Ca2+ nonresponsive. (i) Colony formation (bottom) by MDSL cells that were transduced with an empty lentiviral expression vector (Vec) or one that expresses CAST, as determined by immunoblot analysis (top), and that were treated with DMSO or 10 μM LEN (n = 3 per group from independent experiments). (j) Overview of the proposed mechanism by which LEN, acting through CRBN, induces IKZF1 degradation and GRP68 upregulation, leading to increased intracellular calcium levels and calpain activation. Prior to treatment (no treatment), MDS cells express IKZF1, which suppresses GPR68 expression and intracellular Ca2+ levels. In LEN-sensitive cells, LEN treatment results in IKZF1 degradation (via CRBN), which leads to de-repression of GPR68 expression, increased calcium levels, and activation of CAPN1. In LEN-resistant cells, various connections in the CRBN–IKZF1–GPR68–Ca2+–CAPN1 network could be disrupted and/or inhibited, permitting MDS cell expansion. Throughout, error bars represent mean ± s.e.m. *P < 0.05 by Student’s t-test.

