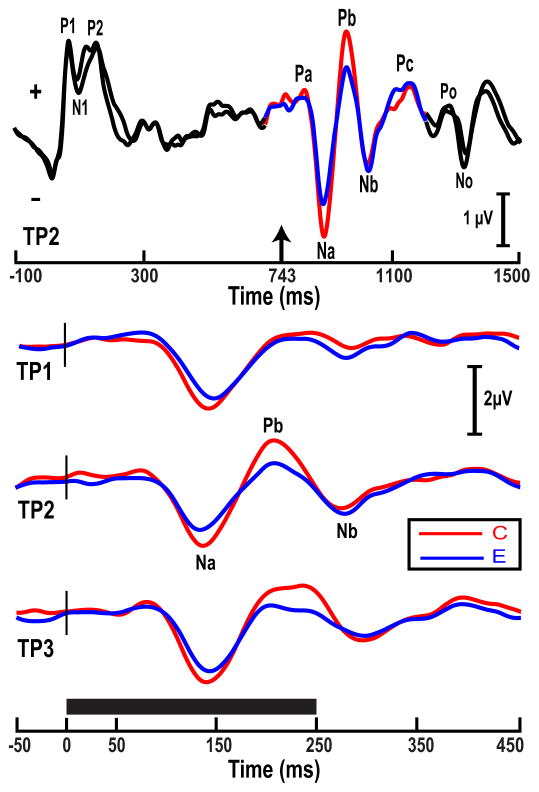
Figure 2.
Grand average waveforms of the Chinese (C) and English (E) groups at the Fz electrode site per pitch stimulus (TP1–3). Waveforms consisting of three segments (top) illustrate the experimental paradigm used to acquire cortical responses: a 250 ms pitch segment (IRN, n = 32) preceded and followed by 750 ms and 250 ms noise segments, respectively. Solid black horizontal bar indicates the duration of each stimulus. The up arrow at 743 ms (top) marks the onset of the pitch-eliciting segment of the stimulus; short vertical stroke (black) marks the time point in the waveforms. See Section 3.1 for details.

