
Figure 3.
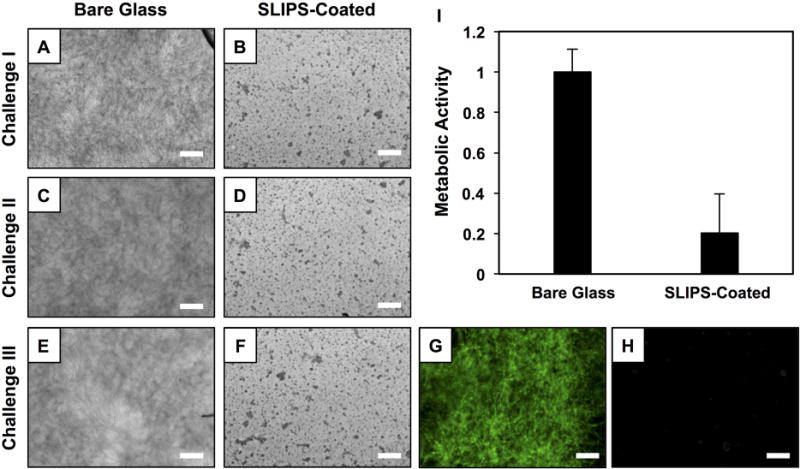
(A–F) Bright-field microscopy images showing the surfaces of bare glass and SLIPS-coated glass substrates after three consecutive 24-hour challenges with C. albicans suspensions. (G–H) Fluorescence microscopy images of the same surfaces shown in (E–F) after staining with the FUN-1 fluorescent dye. (I) Plot showing the quantified metabolic activity of C. albicans on the surfaces of bare glass and SLIPS-coated glass after the third consecutive challenge; metabolic activity was quantified using an XTT assay. Scale bars are 100 μm. Error bars represent standard deviation.