
Figure 4.
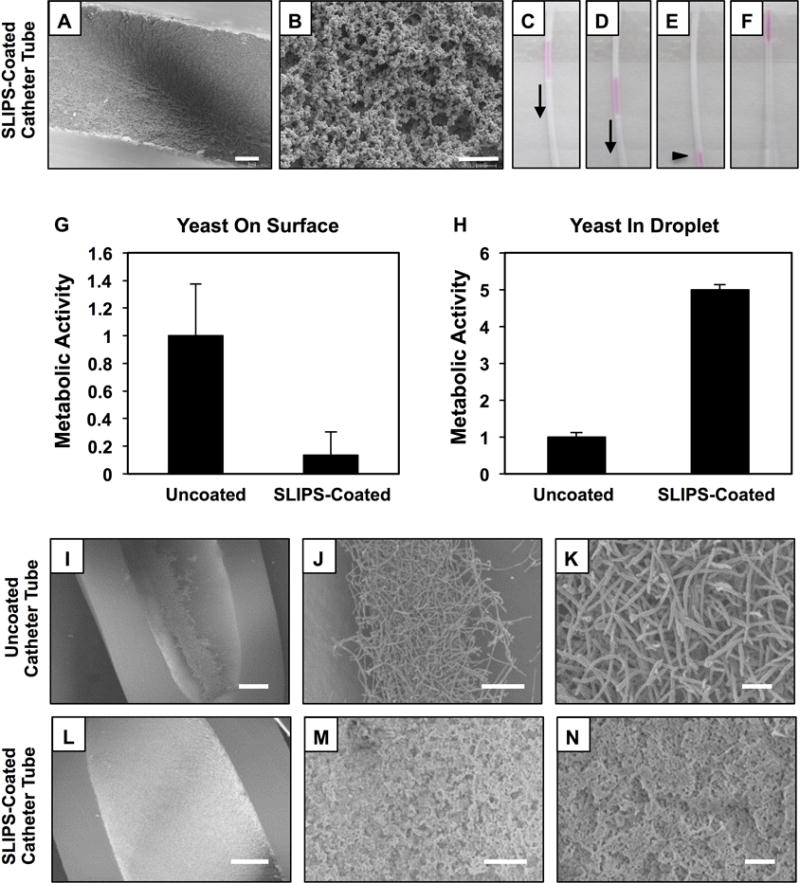
(A–B) Lower- and higher-magnification SEM images showing the surfaces of porous polymer multilayers fabricated on the inner surfaces of catheter tubes prior to the infusion of silicone oil; tube segments were sliced longitudinally prior to imaging (scale bar in A = 100 μm; scale bar in B = 2 μm). (C–E) Digital images showing the sliding of aliquots of aqueous TMR (5 μL) inside SLIPS-coated catheter tubes tilted at an angle of 10°. (F) Digital image showing an aliquot of aqueous TMR at the top end of a bare catheter tube. (G–H) Plots showing the quantified metabolic activity of C. albicans associated with the surfaces (G) of bare and SLIPS-coated catheter tubes and in droplets of yeast inocula (H) collected from bare and SLIPS-coated catheter tubes after 4 hours of incubation. Error bars represent standard deviation. (I–N) Lower- and higher-magnification SEM images of bare (I–K) and SLIPS-coated (I–K) catheter tubes after inoculation with suspensions of C. albicans for 4 hours; samples were prepared by conventional critical-point drying and tubes were sliced longitudinally prior to imaging. Scale bars in panels I,L; panels J,M and panels K,N are 200 μm, 50 μm, and 10 μm, respectively.