Figure 8.

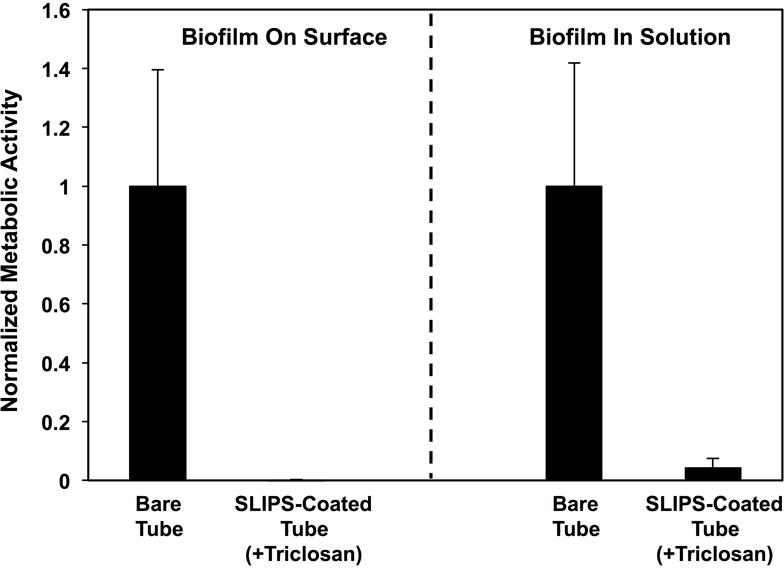
(A) Plot showing the quantified metabolic activity of C. albicans associated with the surfaces of bare glass (black) and triclosan-loaded SLIPS (grey) after each of five consecutive 24-hour challenges in C. albicans inoculum, as determined using an XTT assay. (B) Plot showing the quantified metabolic activity of C. albicans associated with the surfaces of bare glass and triclosan-loaded SLIPS after continuous incubation in C. albicans inoculum for 7 days (see text for details). Error bars represent standard deviation.
