
Fig. 2. MGC yields short mRNA half-lives and correlates with only one of the global methods.
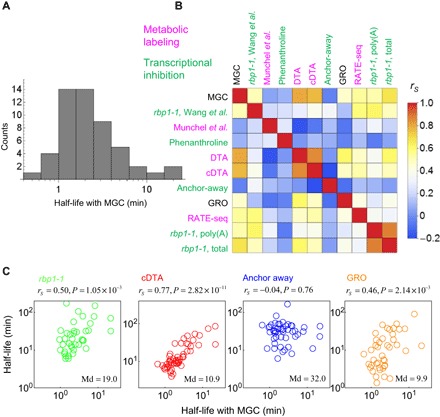
(A) Distribution of half-life using MGC. (B) Correlation matrix of published data sets and half-lives measured by MGC with the Spearman’s rank correlation coefficient. Data from the following studies were compared (the specific method names, when available, are indicated as given in the respective study): rbp1-1, Wang et al. (14), Munchel et al. (16), phenanthroline (15), DTA (17), cDTA (11), the anchor-away (7), Genomic Run-On (GRO) (19), RATE-seq (18), and the study that measured the half-lives of total and poly(A)+ RNA fractions with rbp1-1 (13). The methods using metabolic labeling and transcriptional inhibition are shown in magenta and green, respectively. (C) Correlation of half-lives measured by MGC and the indicated methods (Md, median; rs, Spearman’s rho; P, P value).