
Fig. 6. Determinants of variability in the mRNA decay rate and promoter-independent variation in RNA synthesis rate.
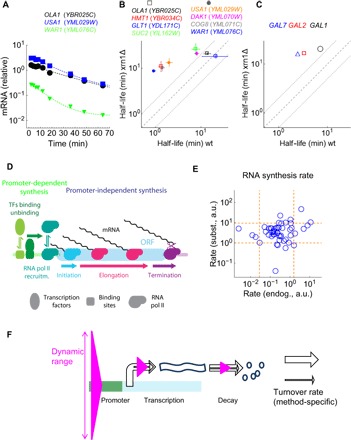
(A and B) Time courses for and half-lives in xrn1Δ and wt cells, determined using MGC. The dashed line represents the expected equality, and the dotted lines are twofold deviations from this equality. Error bars represent the SD of duplicate measurements, except for DAK1, USA1, and COG8, which were triplicated. (C) Comparison of half-lives of the endogenous GAL mRNAs in xrn1Δ and wt cells after galactose washout (right). (D) Scheme of processes contributing to variations of promoter-dependent (green) and promoter-independent (blue-magenta) mRNA synthesis rate. RNA pol II, RNA polymerase II. (E) mRNA synthesis rates under the control of the substitutional and endogenous promoters. The dashed orange lines represent the 0.1 and 0.9 quantiles of the synthesis rates (rs = 0.16; P = 0.24). a.u., arbitrary units. (F) The bases of the magenta triangles are scaled to represent the dynamic range of promoter-dependent and promoter-independent mRNA synthesis rates and the mRNA decay rates, expressed as the 90:10 quantile ratio. The width of the black arrows indicates the turnover rates.