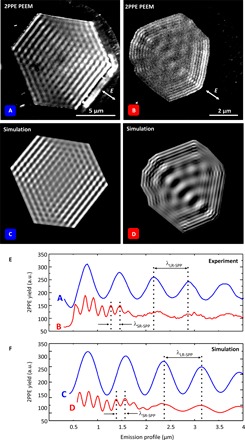
Fig. 2. Normal-incidence 2PPE PEEM results.

(A) Long-range plasmon wave pattern, excited with zero time delay pulses on a 120-nm-thick hexagonal platelet. (B) The platelet is 37 nm high and permits long- and short-range surface plasmon excitation simultaneously. (B) Snapshot at t0 + 4.52 fs time delay, taken from a time-dependent series. (C and D) The PEEM results are modeled, taking all specifications from images (A) and (B) into account. (E) Emission profiles from platelets (A) and (B). From profile (A), the LR-SPP wavelength is determined as λLR-SPP = 785 nm. Profile (B) illustrates the superposition of LR-SPPs and SR-SPPs, where the SR-SPP wavelength is determined as λSR-SPP = 185 nm. (F) The emission profiles derived from the theoretical PEEM images.
