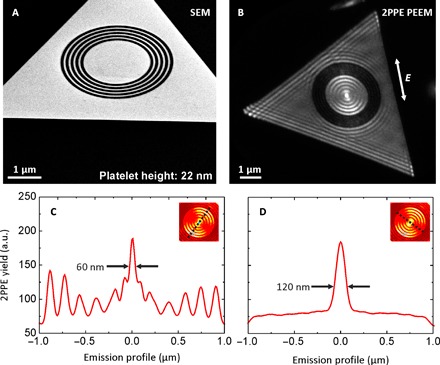
Fig. 3. Nanofocus formation.

(A) SEM image of a 22-nm-high single-crystalline gold platelet, taken at an inclined angle of 54°, patterned with a circular grating of 150 nm period and a central disk with a diameter of 2 μm. (B) 2PPE PEEM at an 800-nm laser wavelength excites both long- and short-range surface plasmons on the structured platelet. Long-range surface plasmons of about 800-nm wavelength are hardly visible, whereas the short-range plasmons are predominant. Because of the surrounding grating, the short wavelength plasmon can couple into the central disk, which acts as a focusing device. At the focal spot, the highest electron emission is observed. From these time-integrated data, the emission profile is characterized perpendicular (C) and parallel (D) to occurring wavefronts. The focus size in profile (C) is determined by the full width at half maximum (FWHM) of the central peak and is 60 nm. (D) The focus width is 120 nm. The images and cuts present raw data without any postprocessing, which is characteristic of the extremely high sample quality and the noninvasive imaging process. They share the same y scale.
