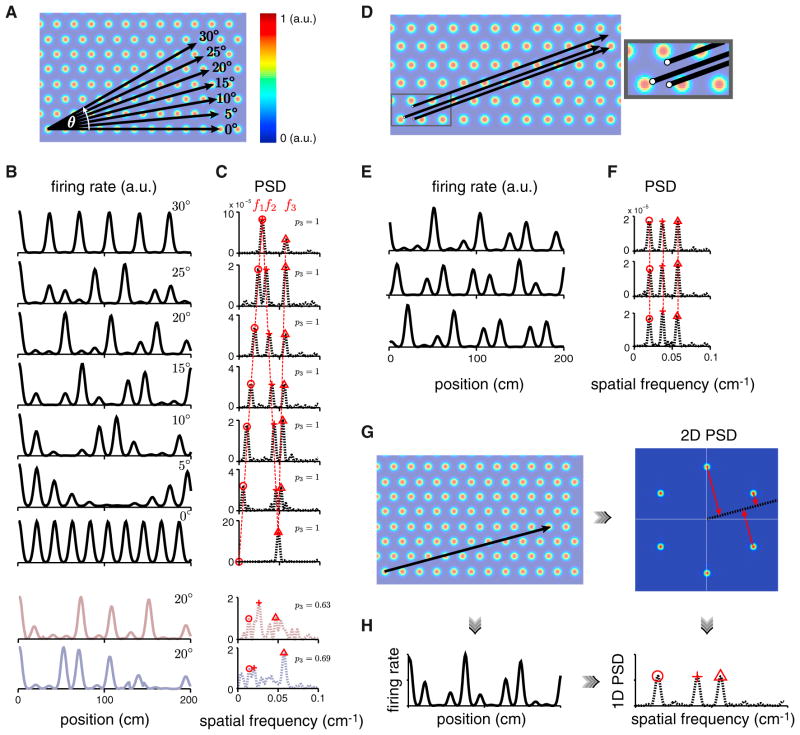
Figure 2. Features of the PSD for Linear Slices through a 2D Triangular Lattice.
(A and B) Different-angle slices (A, black) result in different 1D responses (B, black).
(C) The PSDs (dashed black) also differ, yet have commonalities: they are characterized by three main peaks (red symbols) (at θ = 0° and 30°, a pair of PSD peaks coalesce, for a total of two peaks). Two statistically matched random control tuning curves (reddish- and bluish-gray, B) with corresponding PSDs (C), for the 20° slice.
(D–F) Parallel linear slices with different starting points or phases (D) (inset: magnification of the starting points) exhibit different 1D responses (E) but identical PSDs (F).
(G) Linear slice through a 2D triangular lattice (left), the 2D PSD of the lattice with a slice through the origin at the same angle (black; right).
(H) Left: 1D response from the linear slice in (G, left). Right: PSD of the 1D response at left. This 1D PSD equals the projection (red arrows in G, right) of the 2D PSD onto the same linear slice (also see Figure S1).

