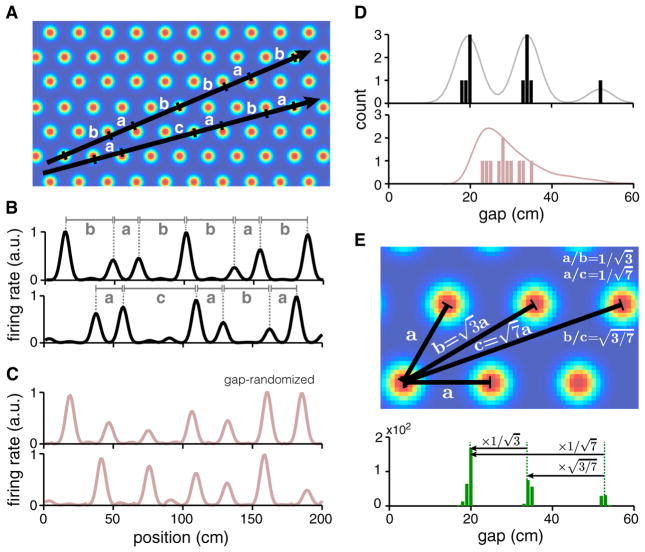
Figure 3. Distribution of Gaps in 1D Slices through a 2D Triangular Lattice.
(A and B) Linear slices (black) at different angles and spatial phases generate different sequences of inter-field distances or gaps (gaps delineated by horizontal lines with vertical ticks in A; equal gaps are marked by the same letter; only peaks with amplitudes above a threshold are considered in B).
(C) Matched random 1D responses (gap-randomized controls) for the responses in (B).
(D) Histogram of gaps for the slices in (B) (black) and the random controls in (C) (reddish-gray). Line: smoothed version of the histogram (gray) and a full gap distribution generated from 100 gap-randomized controls for each of the two slices in (A) and (B) (reddish-gray).
(E) Top: numeric values of the gaps are determined by the specific geometry of the 2D lattice (up to overall scaling by the lattice period), independent of slice angle and phase; gap ratios depend only on lattice geometry. Bottom: a histogram of gaps generated from pooling across 100 linear slices of the same length as in (B), with random angles and phases.

