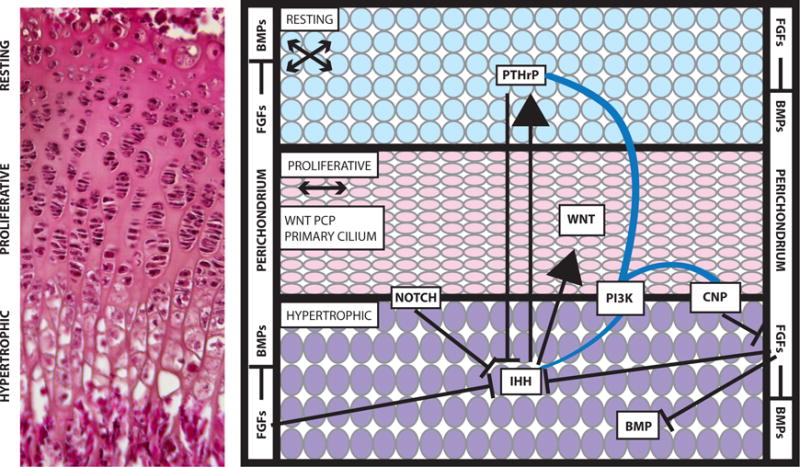
Figure 1. Overview of the growth plate.

Cells within the resting, proliferative, and hypertrophic zones of the growth plate have a distinctive morphology and organization, which is visible in a section through a three-week-old mouse growth plate stained with eosin and hematoxylin (left). The Notch, WNT, FGF, Hedgehog, and BMP signaling pathways act on the cells of the growth plate (right). Arrows indicate activation of one pathway by another, and lines with a bar at the end indicate inhibition of the pathway. Blue lines indicate crosstalk between pathways. For example, PI3K is thought to affect the CNP, IHH, and PTHrP signaling pathways. Many of these pathways have been implicated in multiple skeletal dysplasias. The arrows underneath the names of the resting and proliferative zones indicate the orientation of cell division within these zones. Abbreviations: BMP, bone morphogenetic protein; CNP, C-type natriuretic peptide; FGF, fibroblast growth factor; IHH, Indian Hedgehog; PCP, planar-cell polarity; PI3K, phosphoinositide 3-kinase; PTHrP, parathyroid hormone–related peptide.
