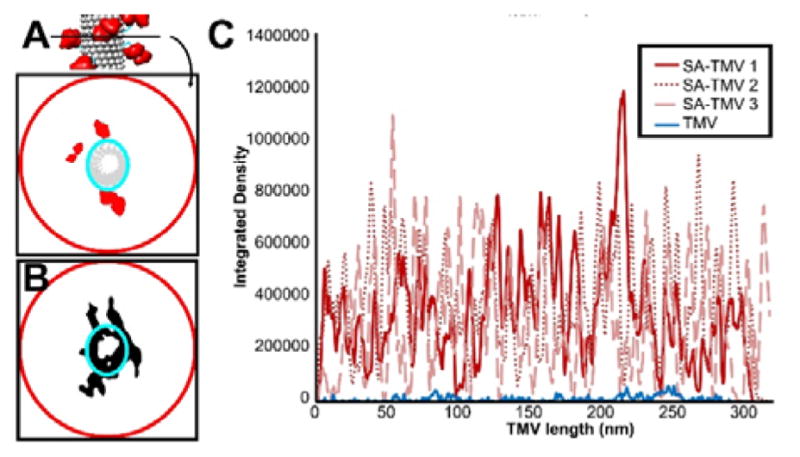
Fig. 6.

Analysis of SA volume coverage of TMV rod. (A) Schematic representation of coverage area analysis. Each TMV rod is broken up into one-pixel wide segments, and the areas filled with density within the larger TMV+SA circle (red) as well as within the smaller TMV-only oval (cyan) are measured. Subtracting the TMV-only area from TMV+SA area gives a measurement of the SA area at each segment along the TMV rod. (B) Experimental example of a one-pixel wide segment from an SA-TMV tomogram with the measurement circle and oval shown. Note that an oval is used to measure the TMV-only area since the tomograms are not corrected for the missing wedge, leading to apparent elongation of TMV along one axis of its cross section. (C) Plot of the coverage for three SA-TMV rods (red) compared to a naked control TMV rod (blue).
