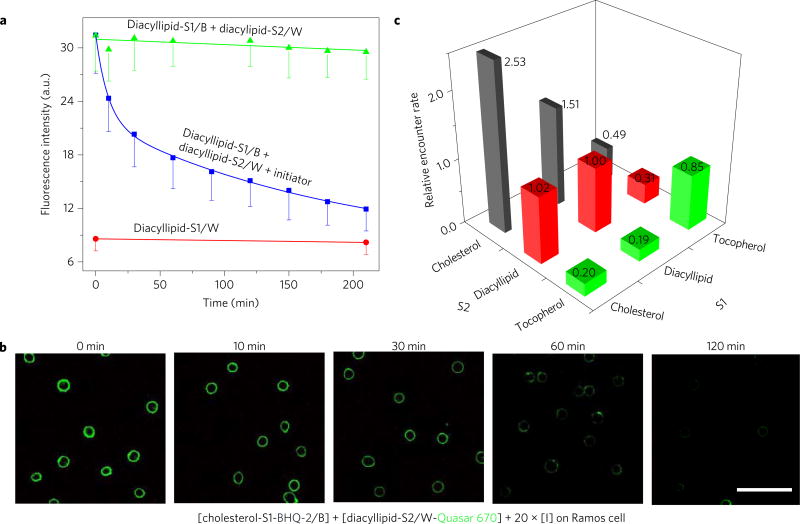
Figure 2. Locomotion of DNA probe on live cell membrane.
a, Locomotion of DNA probe between two diacyllipid-conjugated anchor sites as monitored with flow cytometry. Initially 500 nM of each DNA conjugate was incubated with 5 × 10⁵ Ramos cells ml−1. After washing the non-binding probes away, 10 µM of initiator strand I was added to initiate the strand displacement reactions at time 0. The solid lines in the figures are the fitting curves based on the bimolecular interaction model. All experiments were repeated three times. The error bars stand for the standard deviation from 5,000 cell events at each time point. b, Confocal fluorescence microscopy images for the diacyllipid–cholesterol encounter study. Quasar 670 fluorescent decay was monitored after incubating 150 nM BHQ-2-labelled cholesterol conjugate (cholesterol-S1-BHQ-2/B) and 300 nM Quasar 670-labelled diacyllipid conjugate (diacyllipid-S2/ W-Quasar 670) with 5 × 10⁵ Ramos cells ml−1. Scale bar, 50 µm. The disappearance of Quasar 670 fluorescence (green) over time indicates membrane encounter dynamics between cholesterol and diacyllipid anchors. c, Graph showing relative Ramos cell membrane encounter rates among diacyllipid, cholesterol and tocopherol. Different encounter rates were normalized to that of diacyllipid–diacyllipid. The number of these relative encounter rates are also displayed. Original flow cytometry data are shown in Supplementary Fig. 8 with three repeated measurements. The relative encounter rates were calculated based on equation (6) in the Methods.

