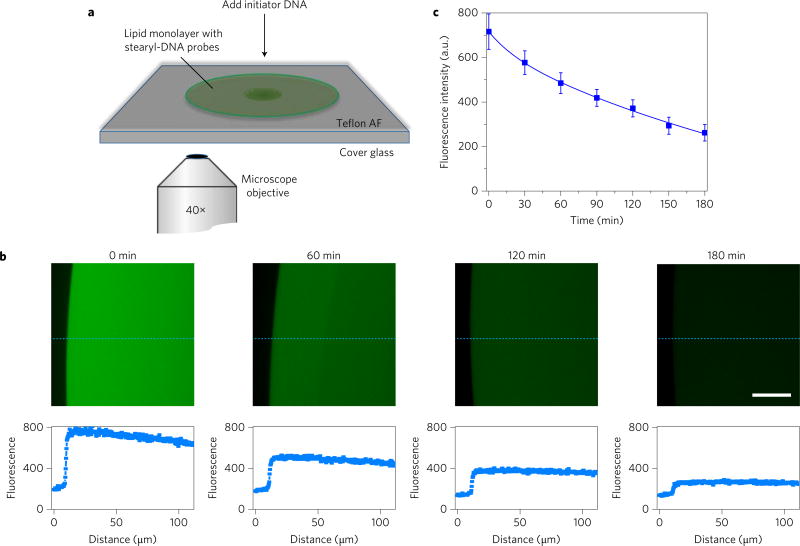
Figure 4. Locomotion of DNA probe on model lipid monolayer film.
a, Illustration of experimental set-up at the fluorescence microscope. Soybean polar extract lipid solution was spiked with stearyl-S2/W-FAM conjugate and stearyl-S1-Dabyl/B conjugate separately at a DNA:lipid ratio of 1:10,000. After dropping and mixing these two DNA–lipid mixtures on a Teflon AF-coated cover glass, a circularly spreading lipid patch was formed. Fluorescence signal of lipid biofilm was monitored for 3 h after adding excess amount of initiator DNA strand. b, Fluorescence microscopy images of stearyl–DNA encounter on model lipid monolayer film. Scale bar, 30 µm. The representative fluorescence intensity curves along the dashed blue line are indicated below each panel. Two other positions were also analysed for each image to calculate the average fluorescence intensity of the lipid monolayer film. c, Locomotion of DNA probe between two stearyl-conjugated anchor sites on model lipid monolayer biofilm as monitored with fluorescence microscopy. At each time point, the fluorescence signal from the edge of the lipid film to 100 µm towards the centre was averaged. The error bars stand for the standard deviation from these data. All experiments were repeated three times.

