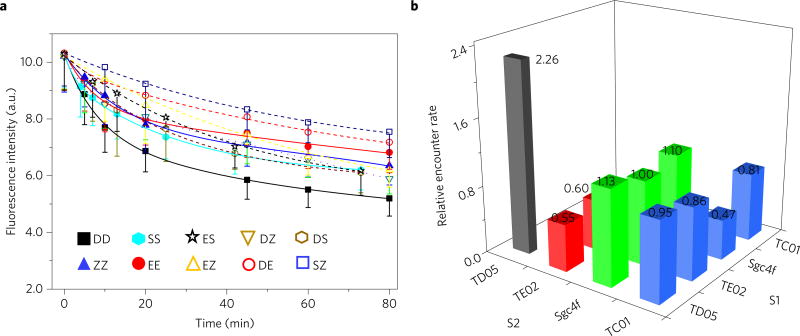
Figure 5. DNA probe–aptamer conjugates to study membrane protein encounter rates.
a, Locomotion of DNA probe between two aptamer-conjugated anchor sites as monitored with flow cytometry. Initially, 100 nM TC01 (Z)-, 400 nM TD05 (D)-, 600 nM TE02 (E)- or 1 µM Sgc4f (S)-conjugated DNA probe conjugates were incubated with 5 × 10⁵ Ramos cells ml−1. After washing the non-binding probes away, 1 µM initiator strand I was added to initiate the strand displacement reactions at time 0. All experiments were repeated at least three times. The error bars stand for the standard deviation from 5,000 cell events at each time point. The fitting curves are based on second-order reaction, Exponential Decay 2 function. The solid lines are used for fitting data between the same type of protein (that is, DD, ZZ, SS and EE), whereas the dashed lines are used between heterogeneous pairs (that is, ES, DZ, DS, EZ, DE and SZ). b, Summarized relative encounter rates among the four types of aptamer–oligonucleotide conjugates studied. Different encounter rates were normalized to that of ES, that is, the locomotion of dye-conjugated probe from Sgc4f aptamer-conjugated S2 to quencher-linked TE02 aptamerconjugated S1. The number of these relative encounter rates are also displayed. The relative encounter rates were calculated based on equation (6) in the Methods.

