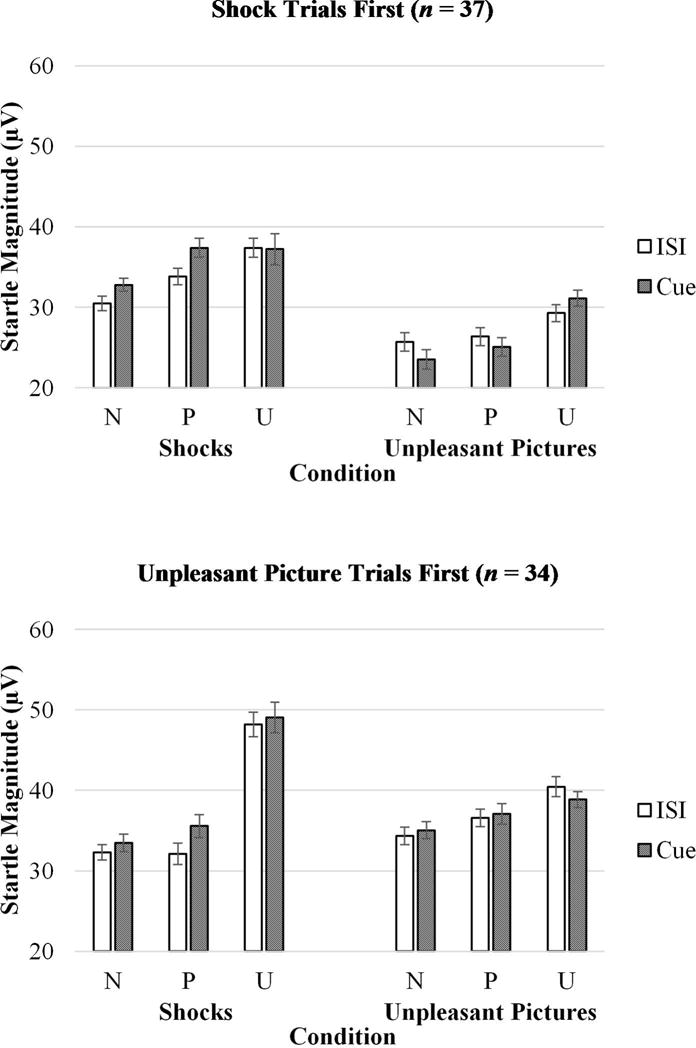
Figure 3.

Startle magnitude across different levels of stimulus (shocks vs. unpleasant pictures), condition (no threat, predictable threat, unpredictable threat), and cue (countdown vs. interstimulus interval) for participants who completed shock trials first (top) and unpleasant picture trials first (bottom). Error bars represent standard error. CD = countdown; ISI = interstimulus interval; N = no threat; P = predictable threat; U = unpredictable threat.
