
Figure 4.
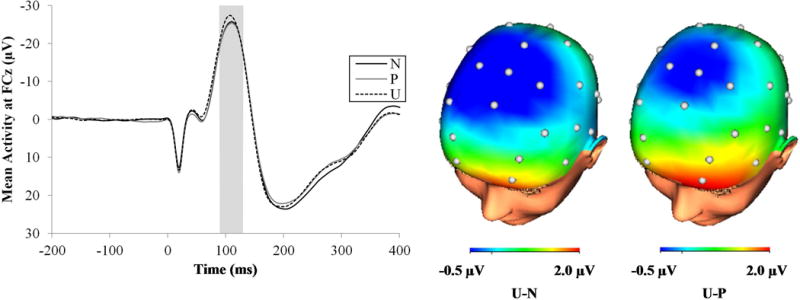
ERP waveforms at FCz (left) and scalp distribution (right) for the probe N100 across the different conditions. Data were collapsed across the countdown and interstimulus interval phases of each condition and the shock and unpleasant picture trials. The shaded regions shows the segment (90 to 130 ms) where the N100 was scored. CD = countdown; ERP = event-related potential; ISI = interstimulus interval; ms = milliseconds; N = no threat; P = predictable threat; U = unpredictable threat.