
Figure 7.
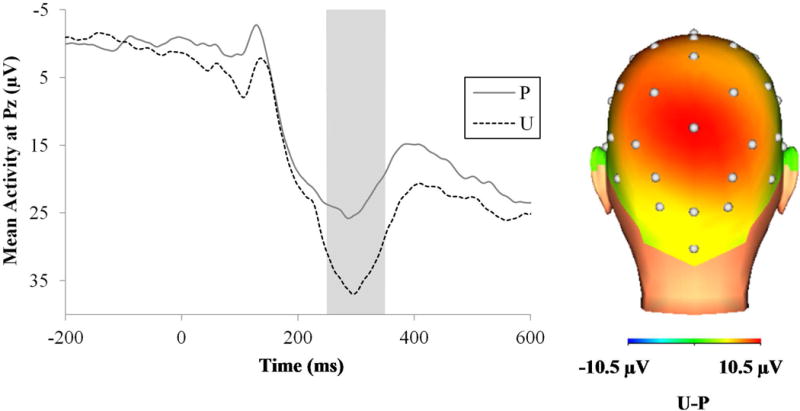
ERP waveforms at Pz (left) and scalp distribution (right) for the P300 to the shocks across the different conditions. The shaded region shows the segment (250 to 350 ms) where the P300 was scored. ERP = event-related potential; ms = milliseconds; P = predictable threat; U = unpredictable threat.