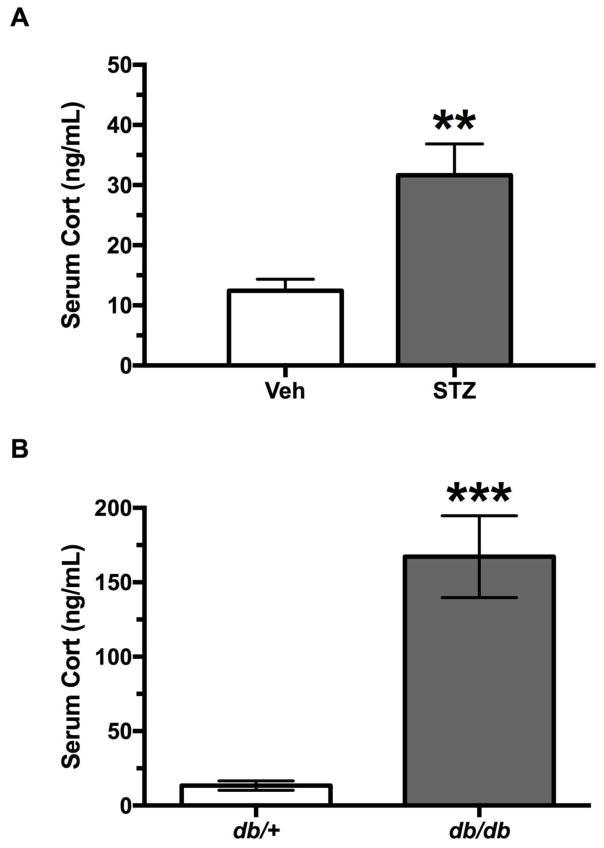
Figure 2.
Serum corticosterone levels (mean ± SEM) for diabetic and non-diabetic control mice. A) Mice injected with Veh (n = 10) or STZ (n = 9) at 28 days post-injection, and B) db/+ non-diabetic (n = 8) and db/db diabetic (n = 8) mice at 9 weeks of age. Asterisks indicate significant difference between groups (**p < 0.01, ***p < 0.001).

