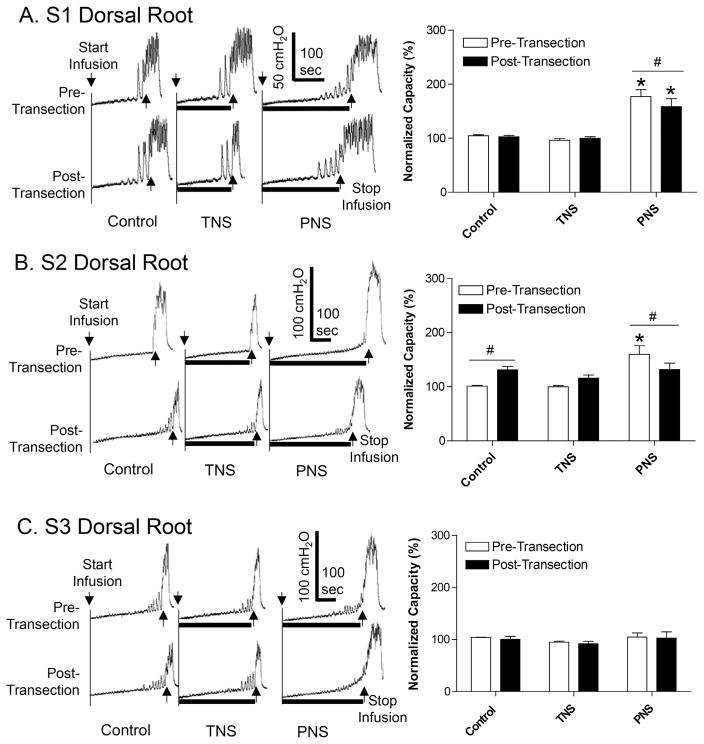
FIGURE 2.
Effect of sequential S1–S3 dorsal root transection on inhibition of bladder overactivity induced by tibial nerve stimulation (TNS) or pudendal nerve stimulation (PNS). A. Transection of S1 dorsal root. B. Transection of S2 dorsal root. C. Transection of S3 dorsal root. Left column: repeated CMG traces with or without TNS/PNS. The black bar under the bladder pressure trace indicates the stimulation duration. Right column: normalized bladder capacity (N = 10 cats). The bladder capacities were always normalized to the pre-transection control for each root transection. * Indicates significantly (P < 0.05) different from the respective control (one-way ANOVA). # Indicates a significant (P < 0.05) difference before and after root transection (two-way ANOVA). TNS: 4T = 3.9 ± 0.65 V, 5 Hz, 0.2 ms. PNS: 4T = 2.1 ± 0.42 V, 5 Hz, 0.2 ms. T is the threshold intensity for inducing anal or toe twitching

