Figure 5.

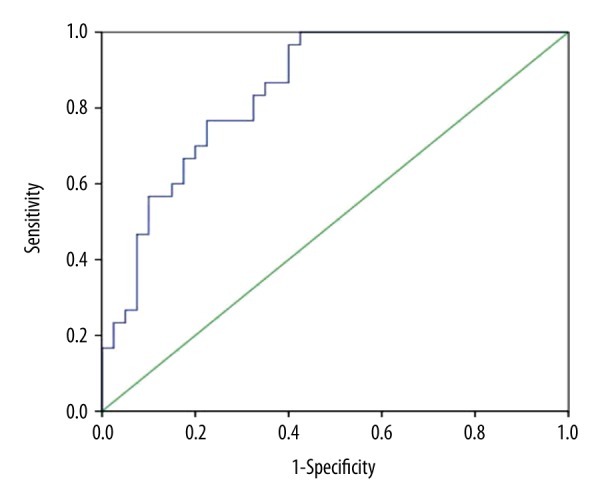
ROC curve analysis predicted the prognosis of pancreatic cancer which showed the different expression of LTBP2. LTBP-2 had an area under the curve (AUC) of 0.846 (95% confidence intervals: 0.757–0.934) and cut-off value of 19.12.

ROC curve analysis predicted the prognosis of pancreatic cancer which showed the different expression of LTBP2. LTBP-2 had an area under the curve (AUC) of 0.846 (95% confidence intervals: 0.757–0.934) and cut-off value of 19.12.