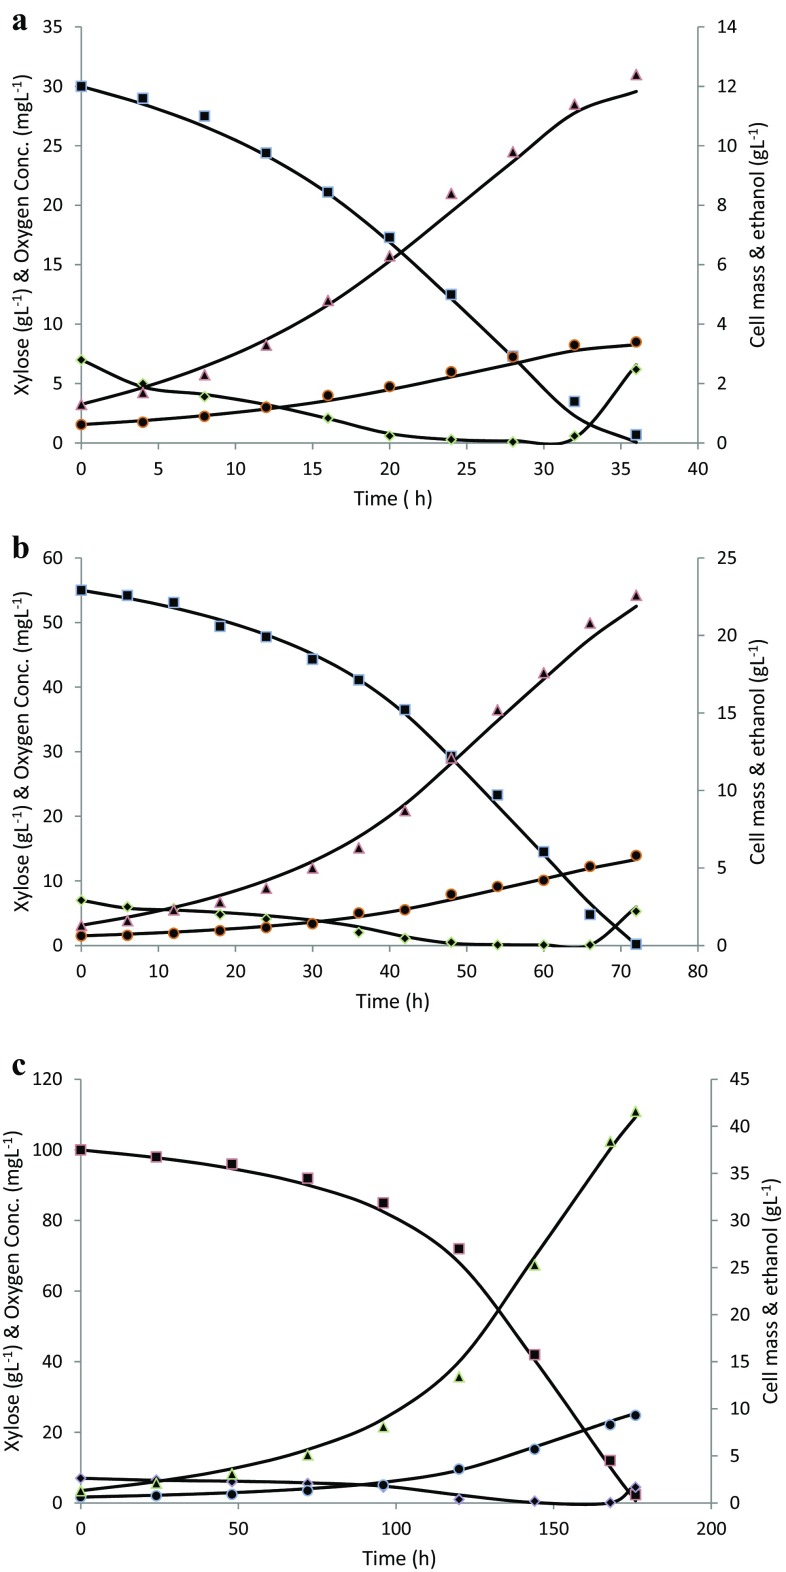
Fig. 4.
Experimental and simulated data by model (line) for various concentrations of xylose hydrolysate streams. a 30 g L−1 initial xylose; b 55 g L−1 initial xylose; c 100 g L−1 initial xylose; experimental data are shown for xylose (filled square); oxygen conc. (filled diagonal); cell mass (filled circle); ethanol (filled triangle)

