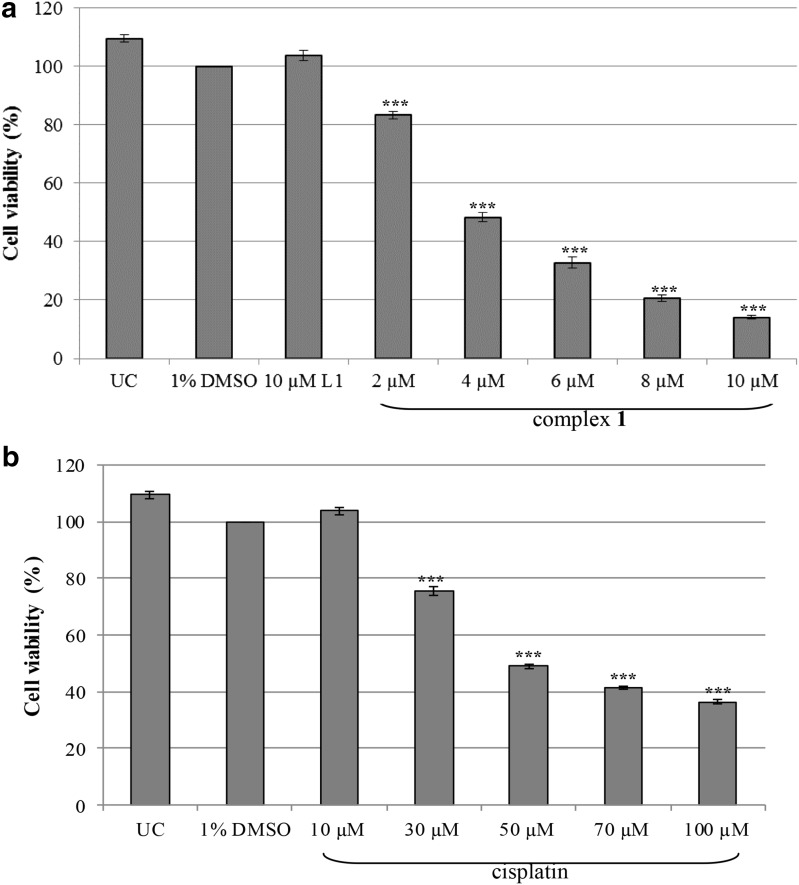
Fig. 1.
Dose-response curves of SNO cells treated with varying concentrations of complex 1 (a) and cisplatin (b) for 24 h. Cells that were untreated (UC) or treated with 1% DMSO served as the negative and vehicle control respectively. In addition, cells were treated with the uncoordinated ligand L1. An alamarBlue® assay was used and the percentage viability is expressed with respect to 1% DMSO (100%). Error bars were constructed based on the Standard Error of the mean (±SEM) (n = 9). The P value was calculated using the two-tailed Students t test. The treatments with a P value of *** P < 0.001 were deemed significant with respect to DMSO

