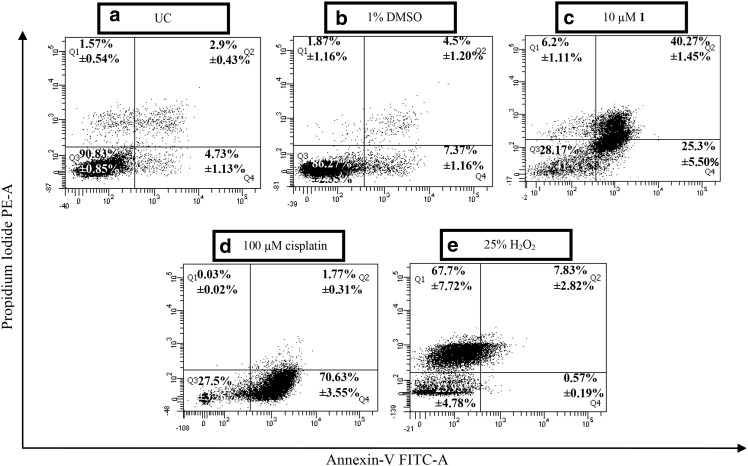
Fig. 4.
Dot blots representing the mode of cellular death induced in differentially treated malignant SNO cells. Analyses were performed using Annexin-V FITC and PI fluorochromes. Cells were either untreated (UC) (a) or treated with 1% DMSO (b), 10 µM of complexes 1 (c) along with 100 µM cisplatin (d) and 25% H2O2 (e) which served as the apoptotic and necrotic controls, respectively. The average percentage was calculated for all quadrants as represented in each quadrant, followed by the Standard Error of the Mean (±SEM) (n = 3). The four quadrants represent Q3 that is negative for FITC and PI, Q4 that is positive for FITC but negative for PI, Q1 that is positive for PI but negative for FITC and Q2 that is positive for both FITC and PI. Cells undergoing early apoptosis are more likely to be found in Q4 while those of late apoptosis will be found in Q2. Necrotic cells are found in Q1 while Q3 indicates intact viable cells

