
Fig. 1.
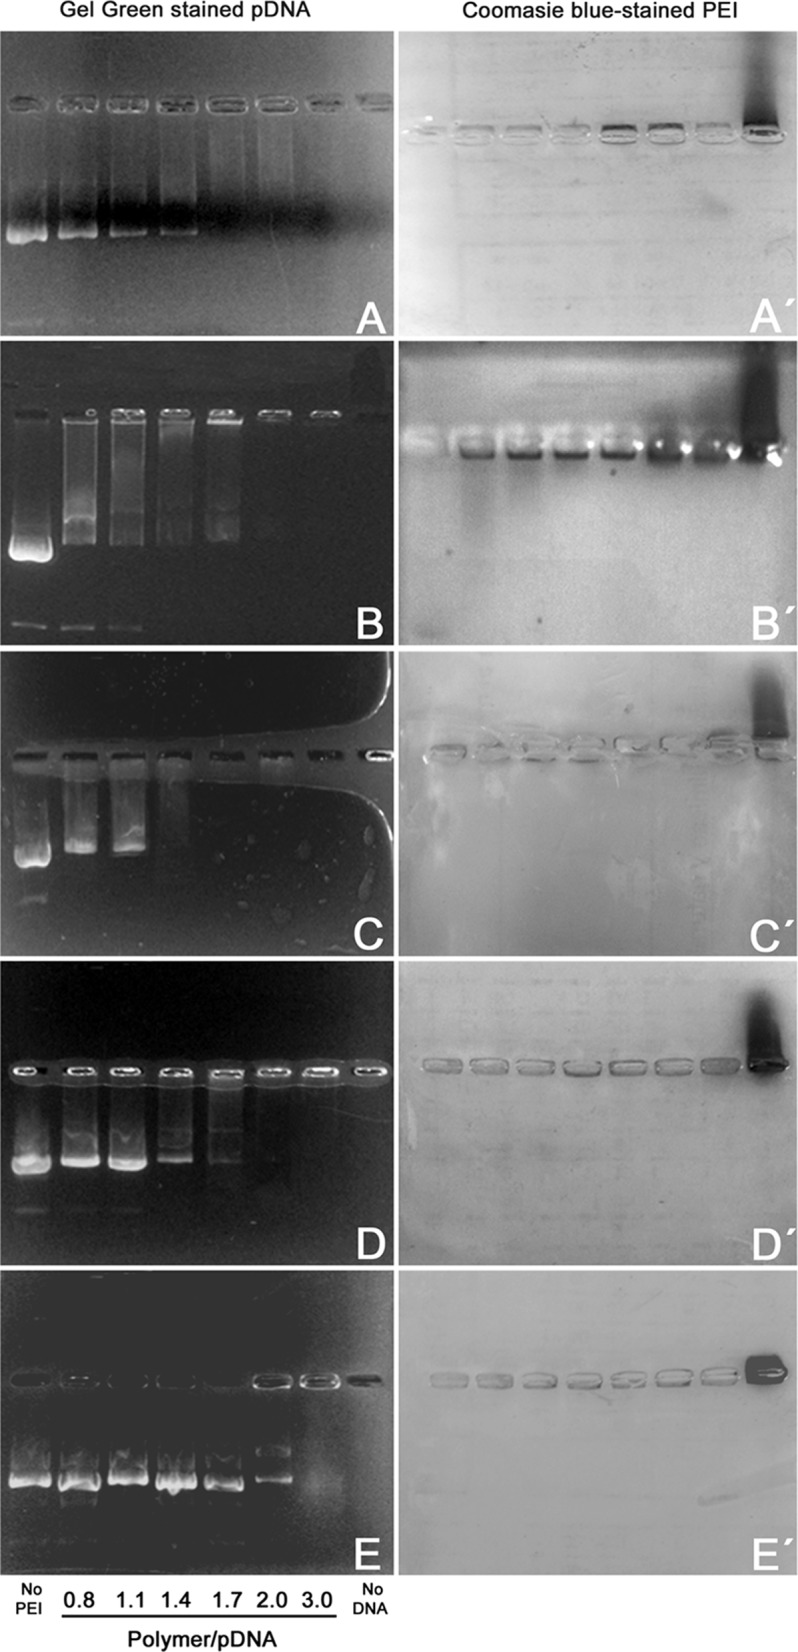
Agarose gel electrophoresis of polymer particles mixed at varying ratios with circular pDNA: 0.8, 1.1, 1.4, 1.7, 2.0 or 3.0. pDNA (3 μg) and polymer alone (5 μg) controls were also included. a PEI 22K. b PEI 25K. c PEI 87K. d PEI 217K. e PAH 58K. Gel photographs on the left show Gel Red stained DNA migration observed under blue LED light. Pictures on the right (a′ through e′) correspond to the same agarose gels stained with Coomassie Brilliant Blue to reveal polymer electrophoretic migration. Reverse migration of polymers alone can be observed on the rightmost lane in each gel