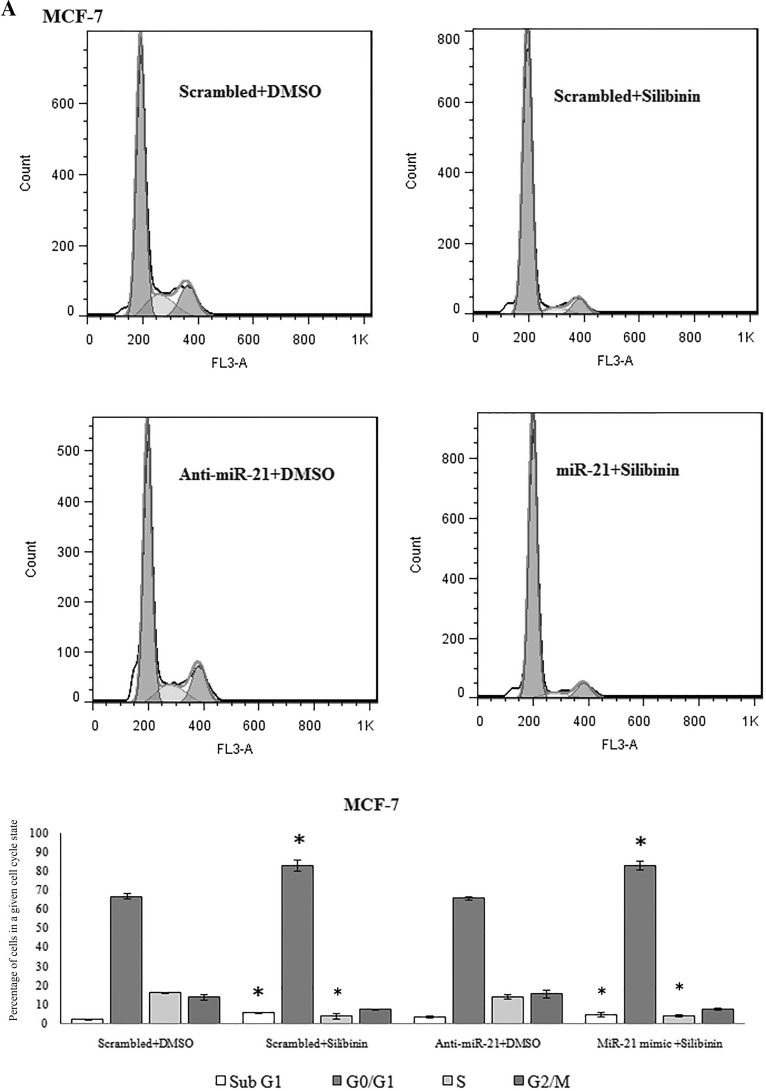
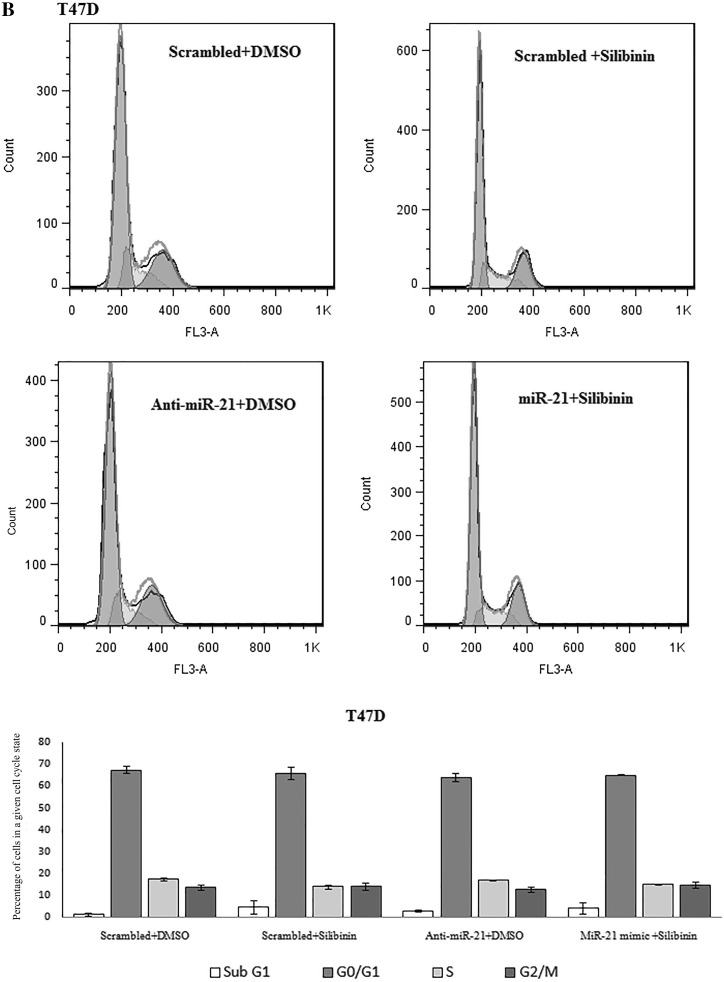
Fig. 8.
Cell cycle analysis by flow cytometry in MCF-7 (a) and T47D (b) cells following miR-21 inhibitor and mimic transfection and treatment with 150 μM dose of silibinin for 48 h. Results were presented as mean (n = 3) ± SD. *P < 0.05, significantly different from control (scrambled + DMSO) by independent t test


