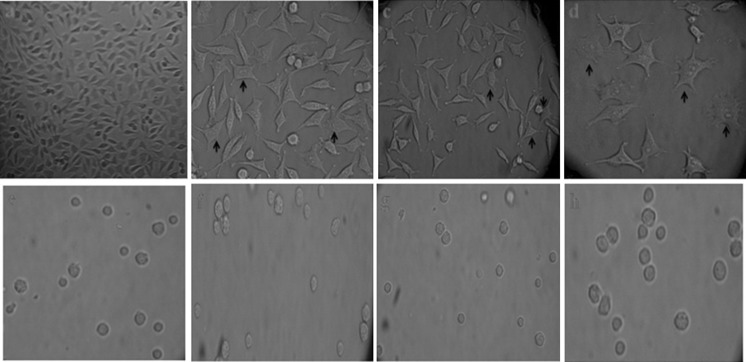
Fig. 3.
Morphological changes on HepG2 (a–d) and PBMC cells (e–h) after exposure with Persian shallot extract at 0 (untreated), 1/50, 1/10 of the IC50 and IC50 concentrations, respectively, that were observed with an inverted microscope under ×400 magnification. Apoptotic cells are indicated by arrows

