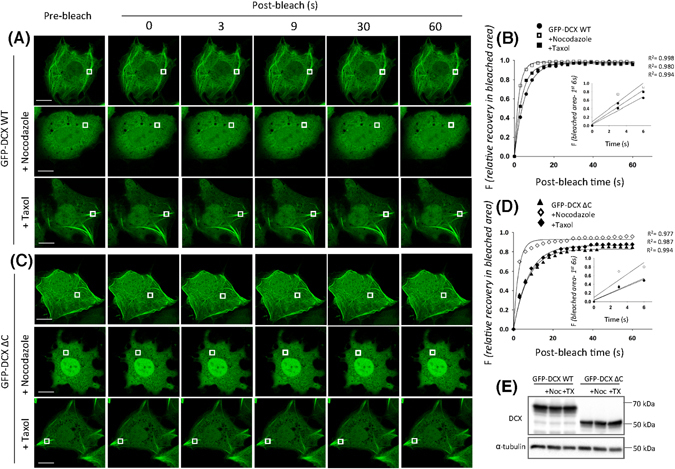
Figure 3.

FRAP analysis reveals that GFP-DCX dynamics can be influenced by agents that alter MT stability. COS-1 cells were transfected to express (A) GFP-DCX WT or (C) GFP-DCX ΔC. Cells were exposed to nocodazole (20 µM, 2 h) to depolymerise MTs or to taxol (10 µM, 1 h) to stabilize MT polymers. A small ROI (indicated by white rectangle in each cell image) was photobleached in (A) and (C) and the fluorescence recovery was subsequently monitored post-bleach at 3 s intervals for 60 s. Plots of the recovery of fluorescence in the small area of bleach for (B) DCX WT and (D) DCX ΔC constructs before and after nocodazole or taxol treatments are shown. Regression values for the accuracy of each curve fit are indicated. The insets represent the initial recovery of fluorescence in the photobleached area for first three time-points (0–6 s of post-bleach) with the line of best fit used for the calculation of the initial recovery rates. (E) Equivalent expression of the GFP-DCX constructs was detected in the presence and absence of nocodazole or taxol by immunoblotting for DCX (upper panel), with equivalent protein loading detected by immunoblotting for total α-tubulin (lower panel). Scale bars represent 10 µm. See Fig. 4 for quantitative pooled data.
