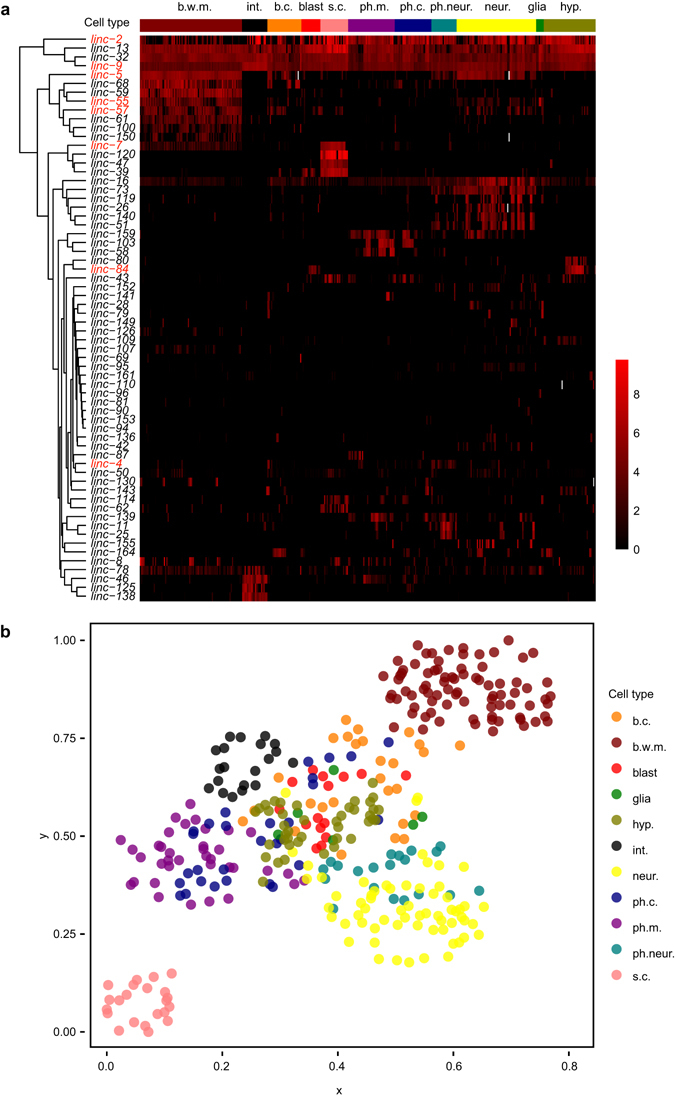
Figure 1.

The single-cell expression profiles of lincRNA reporters. (a) lincRNA reporter expression profiles in newly hatched L1 larvae. The expression level of 64 PlincRNA::reporters in 361 somatic nuclei is shown. The gene expression level is adjusted by calculating (gene expression level + 500)/500, and is plotted as the log2 (adjusted gene expression level). Genes (rows) were clustered according to their expression pattern. 361 somatic cells (columns) were manually arranged according to their cell types and cell position along the anterior-posterior axis of the worm. Grey entries in the heatmap represent missing cells. The data used to generate this figure can be found in Supplementary Table S3. Gene names of eight lincRNAs that are significantly expressed in muscle according to previous SRT-based RNA-seq are in red27. (b) 361 somatic cells clustered by lincRNA promoter reporter expression. A terrain map of nuclei was generated by Genesis according to correlation of gene expression between cells35. Each dot represents a nucleus. Colors indicate different cell types. The distance between two nuclei in the x-y plane indicates similarity in gene expression. Cells with similar gene expression patterns are close to each other, while cells with different patterns are far apart. b.c., other body cells; b.w.m., body wall muscle; blast, blast cells; glia, glia cells; hyp., hypodermal cells; int., intestine cells; neur., neurons; ph.c., other pharyngeal cells; ph.m., pharyngeal muscle; ph.neur., pharyngeal neurons; s.c., seam cells.
