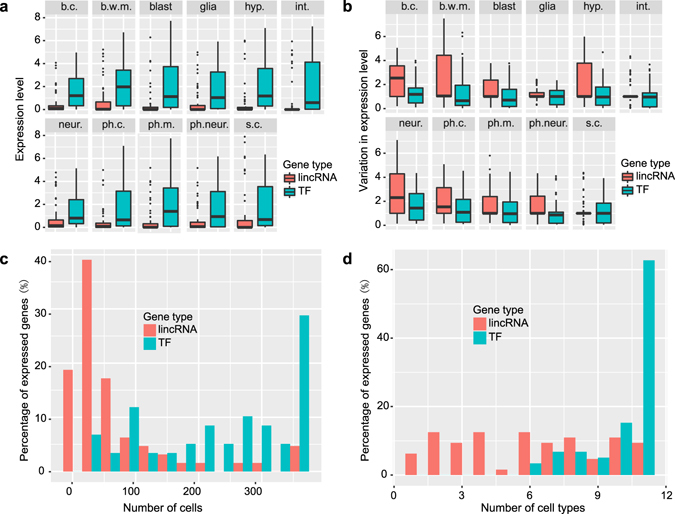
Figure 2.

Comparison of expression features of lincRNA and TF reporters. (a,b) Expression level (a) and the coefficient of variation in expression level (b) of lincRNA and TF reporters in each cell type (CV is calculated as the the ratio of the standard deviation σ to the mean μ). Cell type abbreviation is the same as in Fig. 1. Error bars equal SEM. (c,d) Distribution of the number of cells (c) and cell types (d) in which lincRNA or TF reporters are expressed.
