
Figure 3.
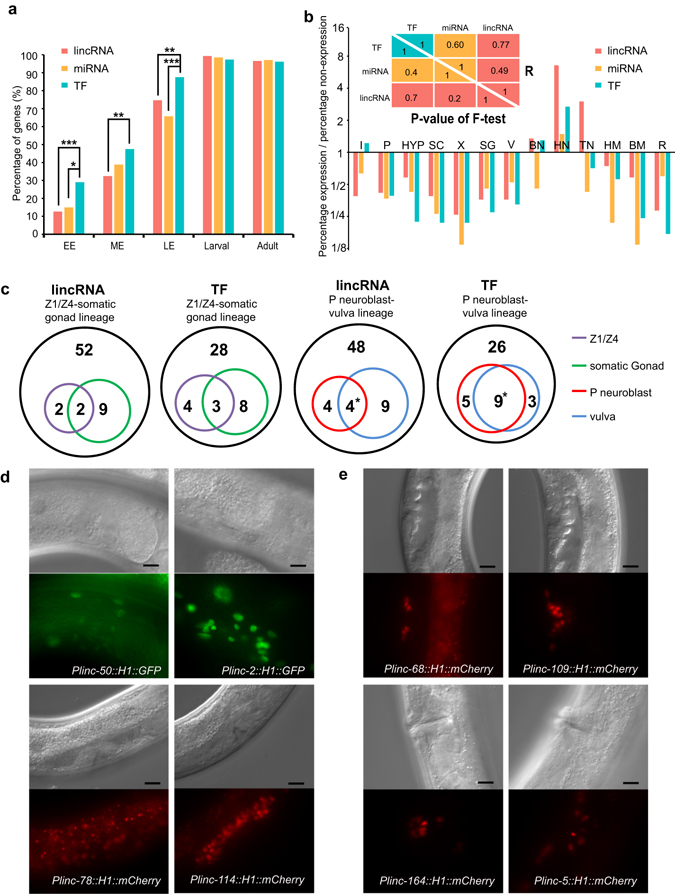
Comparison of spatiotemporal expression patterns of lincRNA, miRNA and TF reporters. (a) Temporal expression patterns of lincRNA, miRNA and TF reporters. Genes in each of the three categories whose promoter reporters show detectable activity are included in the comparison (lincRNA, 142; miRNA, 67; TF, 335). EE, early embryo (pre-comma stage); ME, middle embryo (comma to 1.5-fold stage); LE, late embryo (2-fold to 3-fold stage). *P < 0.05; **P < 0.01; ***P < 0.001, Fisher’s exact test. Detailed information can be found in Supplementary Table S2. (b) Spatial expression patterns of lincRNA, miRNA and TF reporters. The percentage of each gene set expressed in a tissue is shown as an odds ratio. The upper right half of the triangle table shows the correlation of the probabilities of expressed genes in each somatic tissue between the three gene sets, in which Pearson correlation coefficients were calculated based on the log2(odds ratio); The lower left half of the triangle table shows the non-significant P-values resulting from a test of whether the variance of the probabilities that a gene is expressed in each of the somatic tissues is significantly different between each of the three gene sets, P-values were calculated based on the log2(odds ratio) using an F-test. I, intestine cells and intestinal muscle; P, pharynx; HYP, hypodermal cells; SC, seam cells; X, cells of excretory system; SG, somatic gonad; V, vulva and vulva muscle; BN, ventral nerve cord and body neurons; HN, head neurons; TN, tail neurons; HM, head muscle; BM, body muscle; R, anal depressor muscle, anal sphincter, rectal epithelium and rectal gland cell. Corresponding pictures can be found in the C.elegans lincRNA expression (CELE) database (wano.bioinfo.org). Detailed information can be found in Supplementary Table S4. (c) Number of lincRNA and TF reporters expressed in the Z1/Z4-somatic gonad lineage and the P neuroblast-vulva lineage. Black outer circle, the number of whole assayed lincRNA reporters and TF reporters. There is a significant overlap between genes expressed in P neuroblasts and in the vulva, P < 0.05, Fisher’s exact test. Detailed information can be found in Supplementary Table S4, S8. (d,e) Representative lincRNA reporters expressed in somatic gonad (d) and in vulva (e). Scale bar, 10 μm.