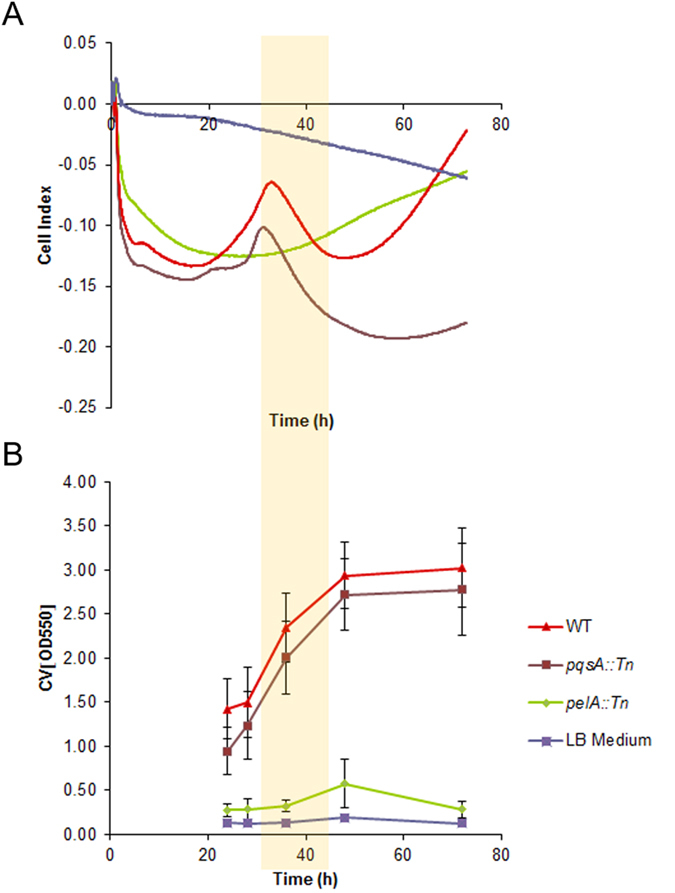
Figure 2.

(A) Changes in the standardized single-frequency impedance (expressed as cell indices) and (B) crystal violet staining measurements of pellicle biofilm over 72 h, during biofilm growth in LB culture medium of PA14 wt, pqsA::Tn mutant, and pelA::Tn mutant (n = 24 for each mutant) and LB Medium (n = 8). The PA14 wild type and pqsA::Tn are biofilm formers; pelA::Tn does not form biofilm. n indicates the number of technical replicates. The period of linear decline of the cell index is highlighted by a yellow bar.
