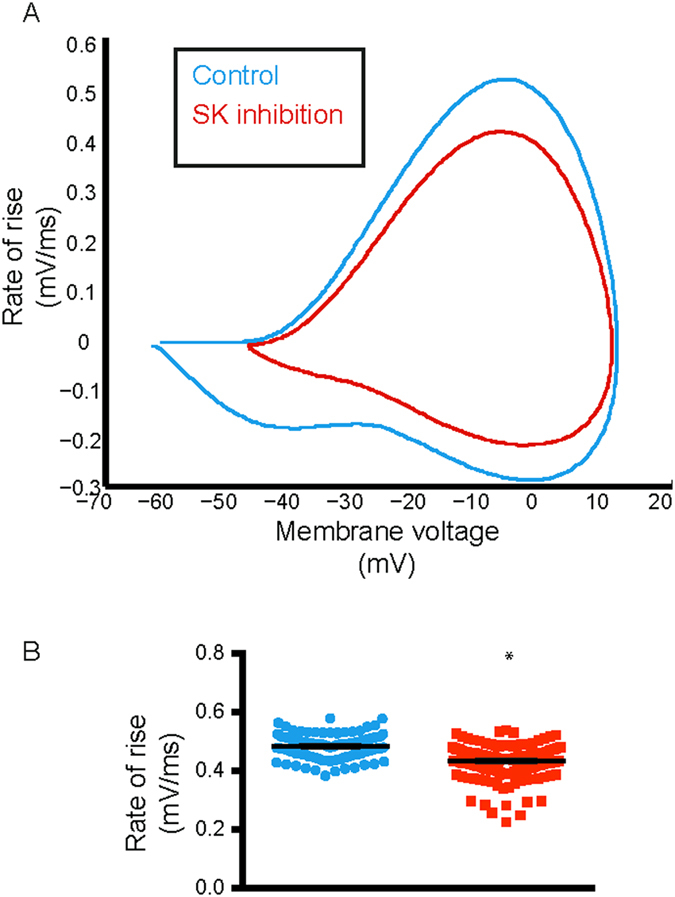
Figure 5.

SK channel inhibition causes a decrease in rate of rise in membrane voltage. Phase-plane plot showed a clear reduction in rate of change in membrane voltage during a simulated SK channel inhibition (red) compared to control (black). (B) This was quantified by a significant decrease in the maximum value of rate of rise of membrane voltage, which is indicative of sodium channel unavailability. Error bars indicate mean ± S.E.M, not visible due to small errors.
