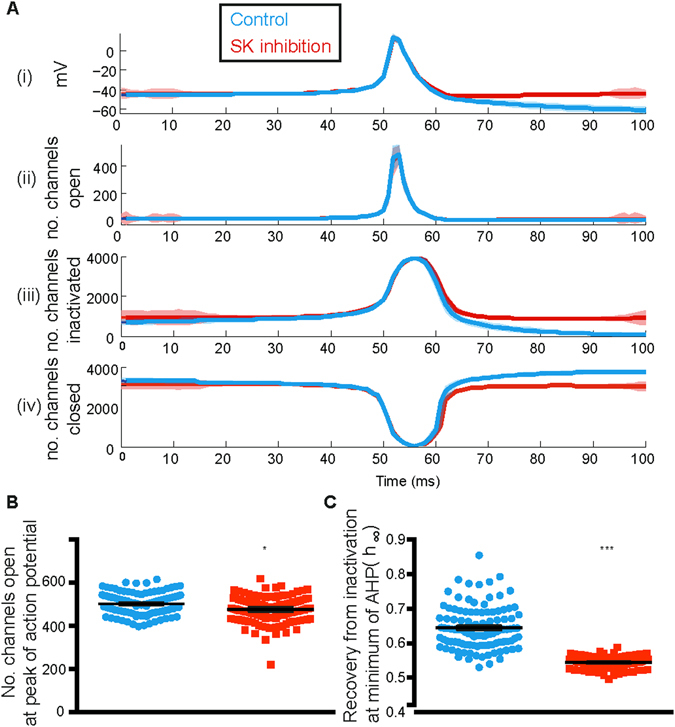
Figure 7.

Failure of recovery from inactivation of sodium channels underlies decrease in firing regularity with SK channel inhibition. Shows the availability of sodium channels (ii–iv) during the course of the action potential (i). The number of sodium channels open increased steadily with depolarisation (ii) following the start of the action potential. This was accompanied by a steady increase in the number of inactivated channels (iii). While the number of open channels went back to zero as soon as the action potential had passed, there was a significant difference between the number of channels that remained in the inactivated state (iii). As the channels recovered from inactivation, they became closed (iv); however once again, a large number of channels failed to go into the closed state because they remained inactivated. Shaded region in (A) represents standard deviation around the mean. (B) Although we cannot see a reduction in the number of open channels during the peak of the action potential, there is a small yet statistically significant reduction in the number of open channels during the spike. (C) The reduction in recovery from inactivation is explained by the reduction in the h parameter of sodium channels inactivation dynamics. h was calculated at minimum membrane voltage attained after spike. Error bars represent mean ± S.E.M, not visible due to small errors.
