
Figure 4.
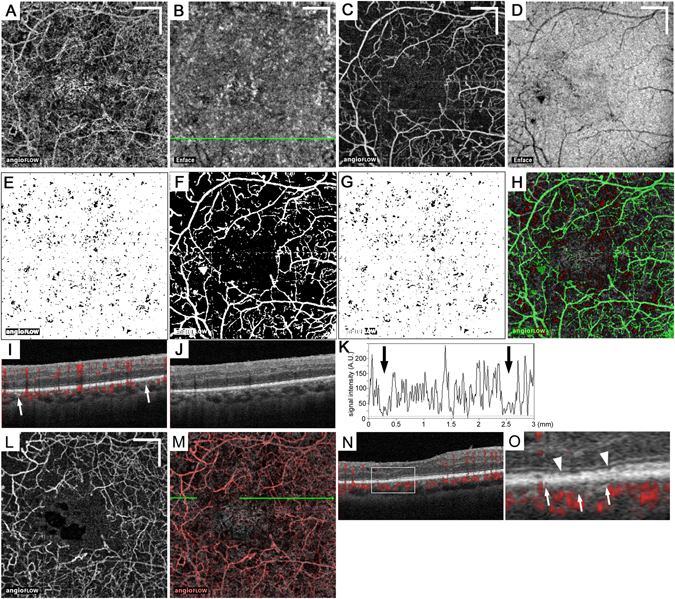
Larger lesions with reduced decorrelation signals in the choriocapillaris slab in a 68-year-old patient with PDR. (A,B) The 10-μm-thick en-face OCTA and structural OCT images in the choriocapillaris layer. The en-face OCTA image in the superficial retinal layer (C) and the structural OCT image at the RPE level (D). (E) The binary image of panel A using the mean decorrelation signal in the outer retina as the cutoff value. (F) The binary image of the projection artifacts and/or shadow artifacts created from panels C and D. (G) The binary image of the areas of flow void after the removal of the areas with the artifacts. (H) The merged image of panel A (grayscale), (G) with inverted signals (red), and the binary image of artifacts (F; green). (I,J) B-scan images with and without decorrelation signals (red) along the green arrow in (B). (K) The intensity of the decorrelation signals along the green arrow in (B). (L) The en-face OCTA image in the deep retinal capillary layer. (M) The merged image of panels A (grayscale) and L (red). (N,O) The sectional image along the green arrow in panel M and its magnified image demonstrate that the EZ line is not intact in the areas of flow voids in both the retinal and the choroidal capillaries (between the arrowheads). (O) The white or black arrows in (I,K, and O) indicate the areas of flow void in the choriocapillaris layer. Scale bar = 500 μm.