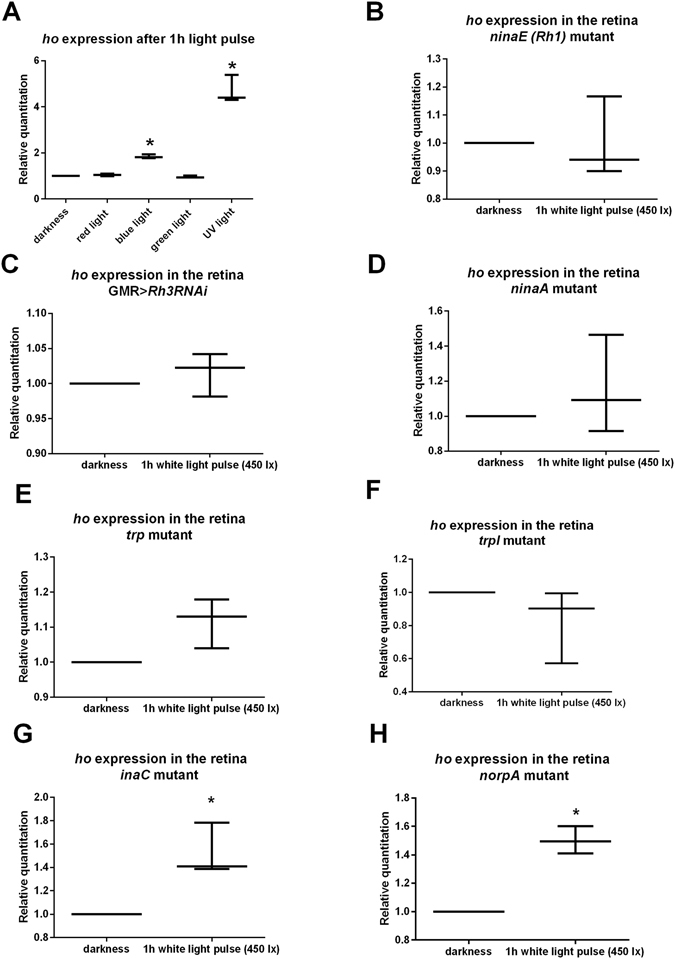
Figure 4.

(A) The ho mRNA level in the retina after 1 h exposure to different wavelengths of light. (B–H) The ho mRNA level in the retina after 1 h of white light exposure. Data are normalized to DD (value = 1.0). Statistically significant differences are marked with asterisks. (B) GMR > Rh3RNAi, (C) ninaE, (D) ninaA, (E) trp, (F) trpl, (G) inaC, (H) norpA. The ends of the vertical bars for each time point represent the range of findings, with the more centrally located horizontal bars the mean.
