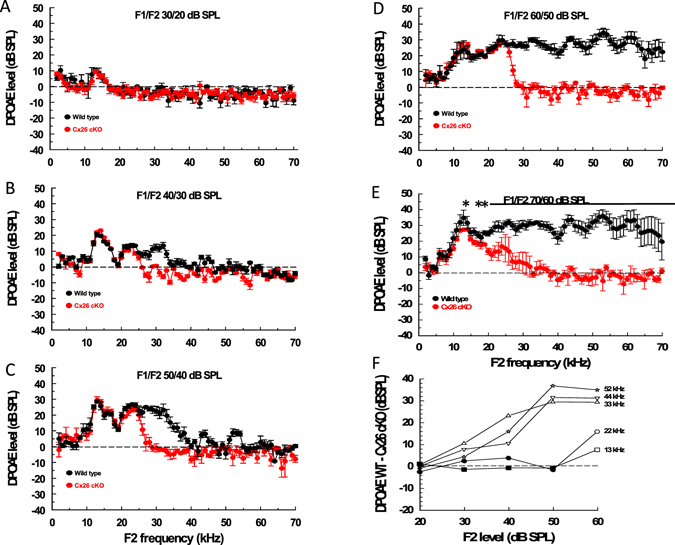
Figure 4.

Low-frequency DPOAE responses are similar in WT and Cx26 cKO mice. (A–E) DPOAE isolevel audiograms (DPOAE 2f1−f2 magnitude, mean ± SD,) as a function of the f2 frequency (f2 levels: A = 20 dB SPL, B = 30 dB SPL, C = 40 dB SPL, D = 50 dB SPL, E = 60 dB SPL; f2/f1 ratio = 1.23; level of f2 set 10 dB below f1 level) from 5 WT (black symbols) and 5 Cx26 cKO (red symbols) mice. Dashed lines indicate measurement noise floor. Solid horizontal lines and asterisks indicate regions and points, respectively, where DPOAEs from WT and Cx26 cKO mice are significantly different (unpaired t-test, 0.05 two-tailed p value). F. Difference in mean magnitude between DPOAEs measured from WT and Cx26 cKO mice (obtained from data presented in Fig. 4A–E) at different frequencies, shown in Fig. 4F, as functions of f2 level. Solid symbols indicate measurements where there is no significant difference between measurements made from WT and Cx26 cKO mice (unpaired t-test, 0.05 two-tailed p value).
