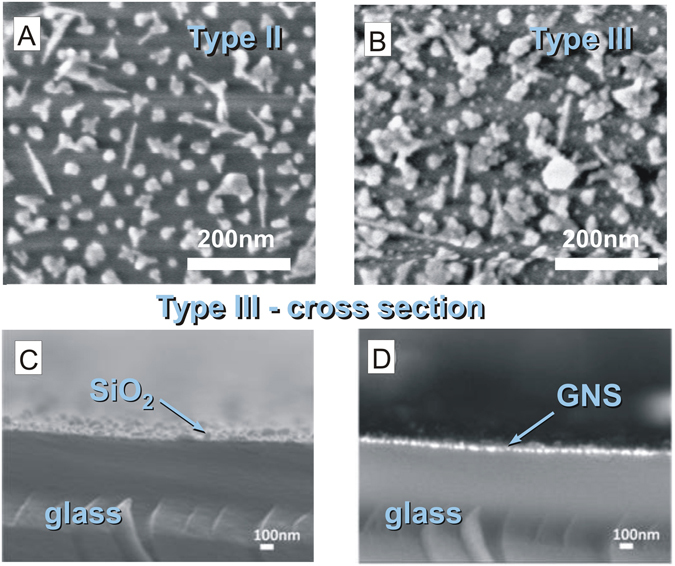
Figure 3.

(A) HR-SEM image of Type II surfaces showing the morphology of GNS attached to the surface; (B) Type III surfaces showing AgNPs as small bright dots on top of the GNS monolayer. (C,D) SEM imaging of Type III slide cross-section showing (C) secondary electron detector topographic image and (D) backscattering electron detector (SEM BSD) image, with bright spots corresponding to the GNS monolayer (The sample is oriented upwards, from bottom to top: glass, GNS, SiO2, AgNP).
