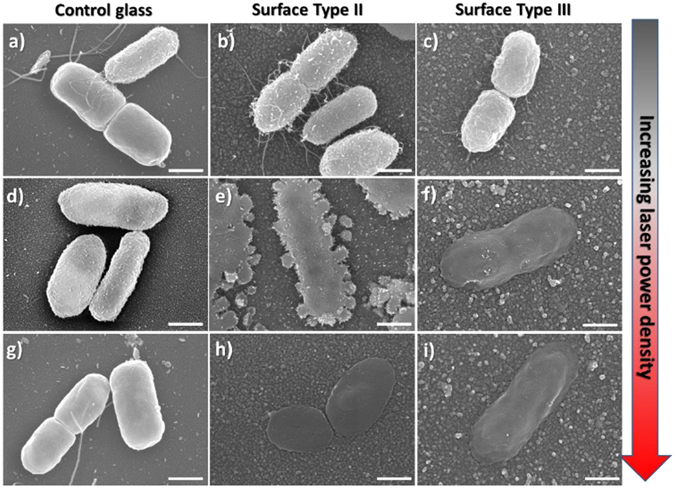
Figure 5.

Representative SEM images showing the effect of laser irradiation on E. coli cells attached to: (by column) (a,d,g) Control glass; (b,e,h) Type II surfaces (glass|GNS|SiO2); (c,f,i) Type III surfaces (glass|GNS|SiO2|AgNP). Increasing power density (by row): (a,b,c) = non irradiated samples; (d,e,f) = samples irradiated with 5× objective lens; (g,h,i) = 20× objective lens. All scale bars are 500 nm. Large area SEM images are shown in ESI (SI14 and SI15a).
