
Figure 2.
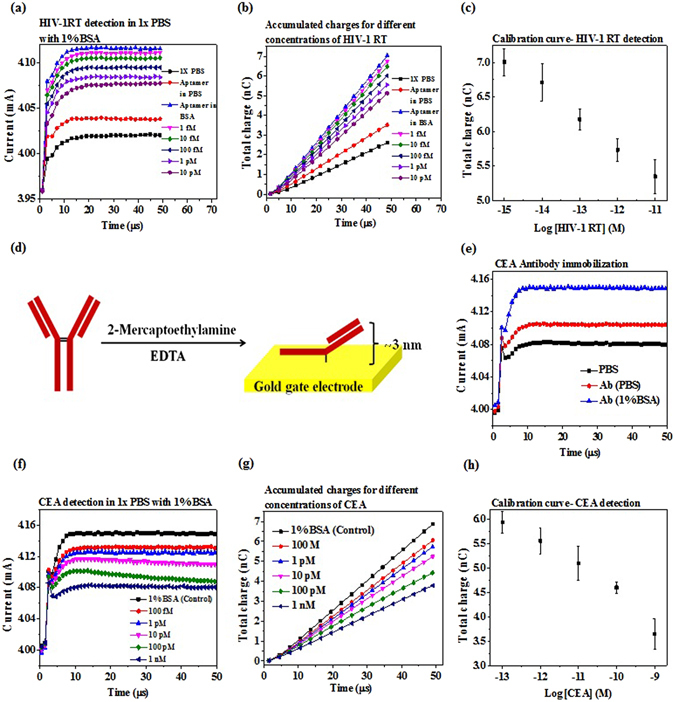
EDL FET biosensor for HIV1-RT and CEA detection. Purified samples are prepared in 1X PBS with 1% BSA in order to simulate the near real conditions of human serum. (a) Aptamer based HIV1-RT detection in 1X PBS containing 1% BSA. Thiolated ssDNA aptamer to HIV1-RT is immobilized on gold gate electrode opening via S-Au self-assembly. The output drain current vs. time graph show successful aptamer immobilization and concentration dependent current gain decrease. (b) Accumulated charges for each HIV1-RT concentration is calculated by integrating drain current over time when the gate bias is applied. Indexing total charge reduces the noise fluctuations and leads to better signal separation. (c) Calibration curve for HIV1-RT detection is plotted by measuring the total charge accumulated for each HIV1-RT concentration. The measured HIV1-RT concentrations are 1 fM, 10 fM, 100 fM, 1 pM and 10 pM. (d) Antibody immobilization technique. Antibody ‘hinge’ region’s disulfide bond is cleaved using mild reducing agent and the resulting native thiol groups of the half IgGs bind to gold via S-Au self-assembly. The protein binding site is nearly 3 nm away from the gold surface. (e) Successful antibody immobilization (anti-CEA) is depicted by the time domain drain current gain before and after immobilization. Since purified CEA proteins are prepared in 1X PBS with 1% BSA, device baseline is measured after anti-CEA immobilization in 1% BSA. (f) CEA concentration dependent drain current decrease. (g) Accumulated charges for each CEA concentration vs. time. (h) CEA calibration curve. The concentration dynamic range represents the clinically relevant CEA detection range. The measured CEA concentrations are 100 fM, 1 pM, 10 pM, 100 pM and 1 nM.