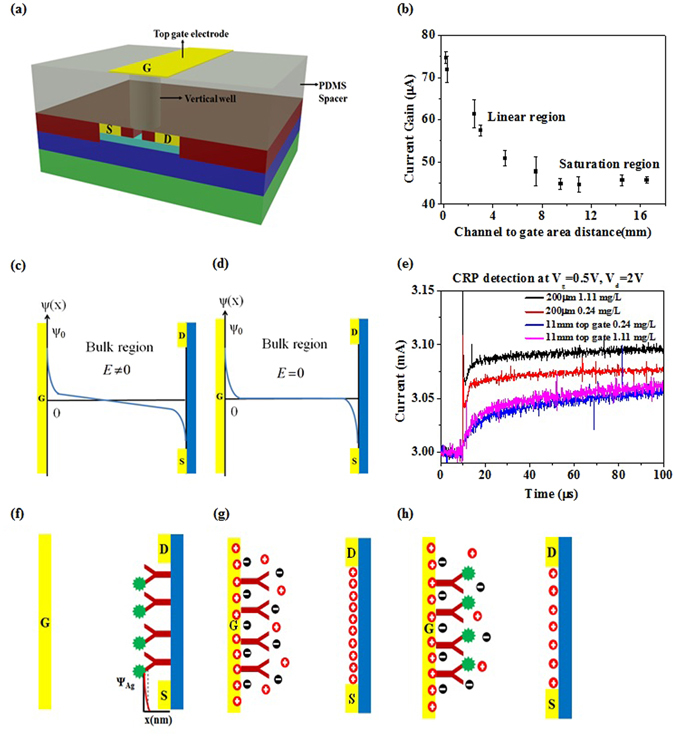
Figure 5.

Working mechanisms of EDL FET biosensors. (a) Schematic representation of the experiment to determine the dependence of voltage drop and hence drain current on a large range of distances between gate opening and active channel. Gate electrode is vertically positioned on top of the active channel separated by the PDMS spacer of varying heights. Typical gate electrode opening area is used in this experiment. Thus the gap distance between gate opening and active channel are designed as 200 µm, 300 µm, 2.5 mm, 3 mm, 5 mm, 7.5 mm, 9.5 mm, 11 mm, 14.5 mm and 16.5 mm. (b) Calculated current gain vs. active channel to gate opening area distance graph. A linear relationship is obtained for smaller distances and saturation is observed for larger distances where the current gain is independent of the distance. (c) Our sensor is designed to operate in the denoted linear region and the applied gate voltage creates a potential gradient across the solution. (d) Depiction of saturation region where the potential gradient is only near the electrode surface. (e) Detection of CRP in linear region and saturation region of gap distances. 0.24 mg/L and 1.11 mg/L of CRP serum samples are tested. Smaller gap leads to larger separation and larger gap lead to very small separation. (f) Conventional FET biosensor schematic model. Charge of the target protein modulates the conductivity of FET. (g) Sensing mechanism in our sensor Distribution of charge density prior to the introduction of target proteins. (h) Protein binding induced gate voltage drop causes local charge density re-distribution in the gate electrode area leading to subsequent changes in the charge density on the active channel.
