
Figure 4.
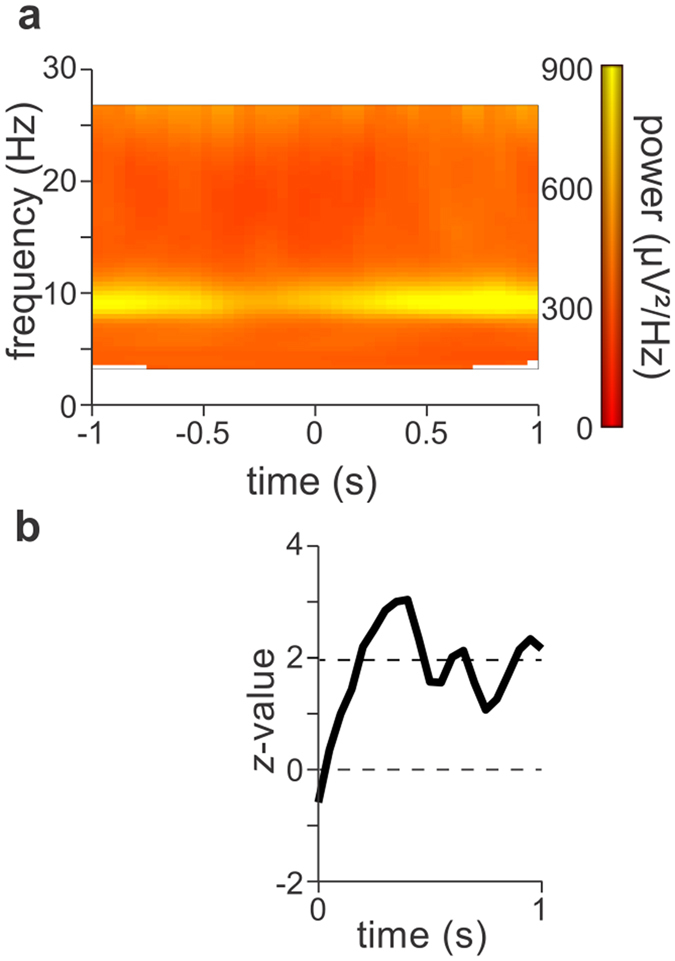
Alpha power predicts the fate of the subsequent perceptual duration right after the emergence of a percept. (a) TFR of the time window around the button press, averaged over the 14 parietal and occipital electrodes indicated in Fig. 2b. Alpha power decreases just before the perceptual reversal and increases thereafter (see Fig. S1 for a precise time course of alpha power only). (b) Alpha power after the onset of an individual perceptual representation was predictive of its subsequent duration, quantified by the z-values computed on a 500 ms long sliding window in the interval between 0 s and 1 s. The dotted line at 1.96 indicates the z-value threshold at p-value = 0.05.