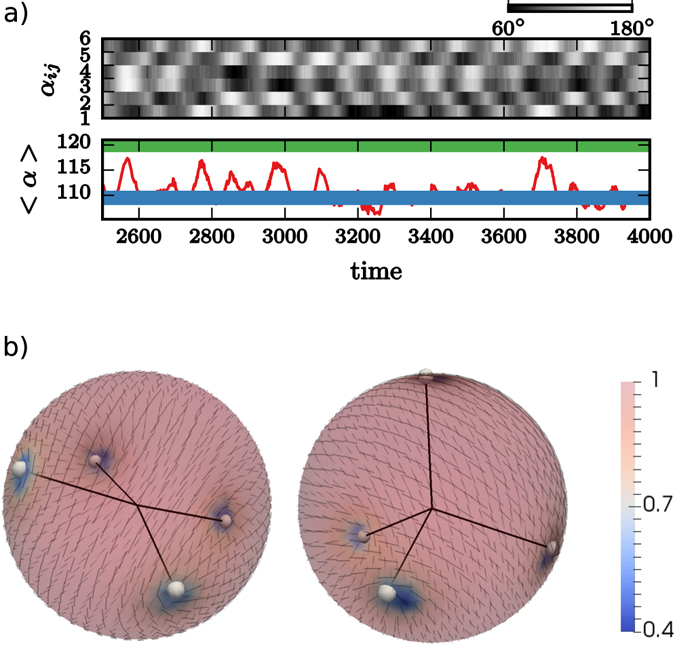
Figure 1.

Defect oscillations: (a) Top: Kymograph showing the time evolution of the angles α ij. Bottom: Oscillation of the average angle 〈α〉. The blue and the green line correspond to the planar (〈α〉 = 120°) and tetrahedral (〈α〉 = 109.5°) defect configuration. (b) Snapshots showing the planar and tetrahedral defect configuration within a simulation of 1.000 particles (the four 1/2 disclinations are highlighted, the director field is shown - black lines - and the color coding corresponds to the nematic order parameter P, with minima in the four defects). The results are in excellent agreement with the experimental results in ref. 7. A video is provided in the SI.
