
Figure 1.
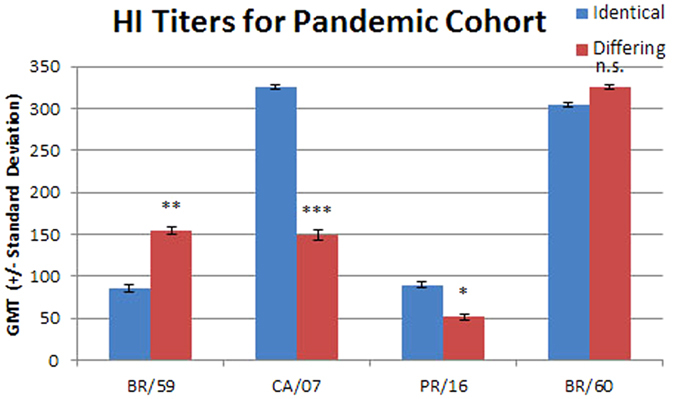
The geometric mean titers for sera from the identical and differing groups in the pandemic shift cohort are shown with standard deviations. The viruses used are listed on the x axis: BR/59, A/Brisbane/59/2007 (H1N1); CA/07, A/California/07/2009 (pdmH1N1); PR/16, A/Perth/16/2009 (H3N2); and BR/60, B/Brisbane/60/2008 (Victoria). The difference between the identical and differing groups was evaluated using the Mann Whitney rank test. n.s., not significant; *p ≤ 0.05; **p ≤ 0.01; and ***p ≤ 0.001.