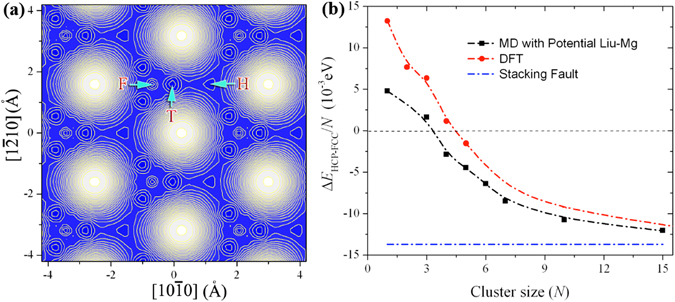
Figure 2.

(a) The surface potential landscape in association with diffusion of an adatom on surface (0001), revealing three local stabilized sites, the fcc site (F-site), the hcp site (H-site) and the tetrahedral site (T-site) in a fcc structure. (b) The variation of the energy difference between the fcc and hcp structures with the cluster size. ΔE HCP−FCC/N represents the average energy difference between the fcc and hcp structures of a cluster on the surface. The blue dashed line indicates the energy difference corresponding to the stacking fault in hcp structure.
