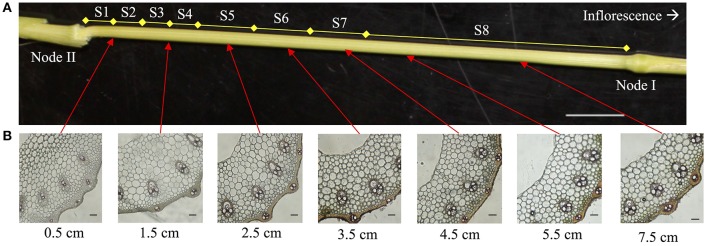
Figure 2.
Internode II samples used for cell wall analysis. (A) Internode II of elongating stem at booting stage when the panicle is about to emerge. Segments (S1–S8) used for cell wall analysis are indicated. Scale bar is 1 cm (B) phloroglucinol stain of cross-sections taken from the bottom (left) of the elongating internode to the top (right) indicate the gradual accumulation of lignin. The labels below each photo indicate the distance from node II. Scale bars are 100 μm.

